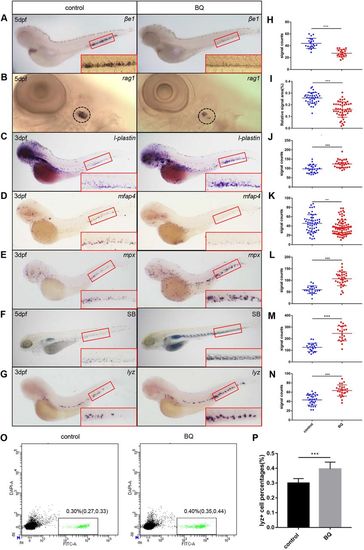
Expression of lineage-specific markers in zebrafish was detected using WISH and SB staining. (A,B) Loss of βe1-globin (n=20) and rag1(control group n=37, BQ group n=49) expression in 5?dpf embryos exposed to BQ. The red boxed regions show magnified views of the caudal hematopoietic tissue (CHT). Relative rag1+ thymocyte-signal areas were analyzed using ImageJ software. The circled regions show the thymus. (C) Increase in l-plastin expression upon BQ exposure at 3?dpf (control group n=25, BQ group n=30). (D) Expression of the macrophage marker mfap4 was reduced in the BQ exposure group (control group n=52, BQ group n=76). (E,G) The neutrophil markers mpx (E) (control group n=20, BQ group n=33) and lyz (G) (control group n=39, BQ group n=35) both showed increased expression in embryos at 3?dpf following BQ exposure. (F) Increased SB+ cells were observed in the BQ exposure group compared with the control group (n=21 per group). (H–N) Quantification of WISH and SB staining for A–E (Student's t-test, mean±s.d., **P<0.01, ***P<0.001). (O) Dot plot of flow cytometry analysis of lyz:GFP+ cells from control (left) and BQ-treated fish (right). Three independent experiments (in each group, 100 embryos are pooled together) were conducted. (P) Percentage of lyz+ cells in each group [0.30% in the control group and 0.40% in the BQ group; Chi-squared test (95% c.i.), ***P<0.001].
|
