
Fig. 4
- ID
- ZDB-FIG-190625-41
- Publication
- Hadzhiev et al., 2019 - A cell cycle-coordinated Polymerase II transcription compartment encompasses gene expression before global genome activation
- Other Figures
- All Figure Page
- Back to All Figure Page
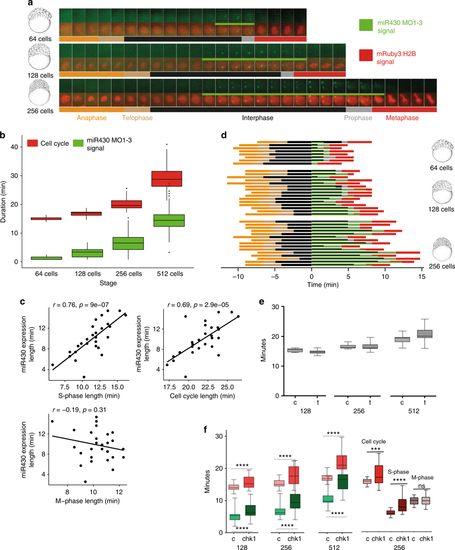
The S-phases of cleavage stage cell cycles are permissive to transcription and/or transcript retention. a Cell cycle length (anaphase to anaphase detected by mRuby3:H2B in red) and miR430 expression (MO signal in green) during early blastula stages. Frames were acquired in 49 s intervals. b Box plot quantification of elongation of miR430 signal (green) alongside cell cycle length (red). Data from 2 embryos are calculated. Total number of nuclei (cell cycle): 64-cell = 17, 128-cell = 60, 256-cell = 62. All groups were significantly different from one another (p < 0.001) (One-way ANOVA with multiple comparisons). Middle line = median. whiskers = nearest hinge ± 1.5 * interquartile range. cCorrelations of cell cycle, S-phase and M-phase length with miR430 expression length, at 256-cell stage (2 embryos, 15 nuclei each). The Pearson correlation coefficient (r) and the corresponding p-value (p) are shown on each plot. d Cell cycle phase segmentation as shown in (a). Horizontal bars represent a nucleus each, they are aligned to onset of detection of miR430 expression and ordered according to length of miR430 expression and cell cycle length. x-axis shows time in minutes. e Effect of triptolide treatment on cleavage stage cell cycle length. Lightsheet microscopic images for nuclear pattern of mRuby3:H2B were analysed to assess cell cycle length and data merged from 4 embryos, 15 nuclei each. Water-injected controls (c) and triptolide-treated (t) are shown at stages as indicated. No statistical difference was found between c and t by Mann–Whitney U test. f Left: relationship between the lengths of cell cycle measured by mRuby3:H2B pattern (red) and pri-miR430 activity detection measured by MO signal (green) in control RNA and chk1 mRNA injected embryos. Data was analysed from 4 embryos, 15 nuclei each at stages as indicated. Statistical significance was measured by Mann–Whitney U test, p < 0.001, whiskers show max and min values. The middle line represents the median. Right: comparison of cell cycle length, S-phase and M-phase for 256 cell stage nuclei, from the chk1 injected and control embryos. Data from 3 embryos, cell cycles compared using Mann–Whitney test, and S and M-phase data compared using unpaired t test. ***P = 0.0004, ****P < 0.0001. Source data for (b–f) are provided as a Source Data file. Zebrafish embryonic stages schematics on panels (a, d) are reproduced from Kimmel et al., 1995, Developmental Dynamics 203:253-310 by permission of John Wiley & Sons, Inc. |