
FIGURE
Fig. 1-S1
Fig. 1-S1
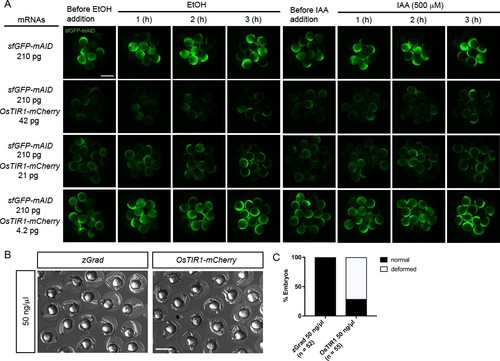
Characterization of the AID system in zebrafish.(A) Images of embryos injected with sfGFP-mAID mRNA and different amounts of OsTIR1-mCherrymRNA and incubated with 0.2%EtOH (left) or the auxin IAA 500 µM (right) over a 3 hr time course. Scale bar: 1 mm. (B) Images of embryos injected with zGrad mRNA and OsTIR1-mCherry mRNA at 24 hpf. Scale bar: 1 mm. (C) Percentage of deformed embryos among embryos injected with zGrad mRNA and OsTIR1-mCherry mRNA at 24 hpf. |
Expression Data
Expression Detail
Antibody Labeling
Phenotype Data
Phenotype Detail
Acknowledgments
This image is the copyrighted work of the attributed author or publisher, and
ZFIN has permission only to display this image to its users.
Additional permissions should be obtained from the applicable author or publisher of the image.
Full text @ Elife