
FIGURE
Fig. 3
Fig. 3
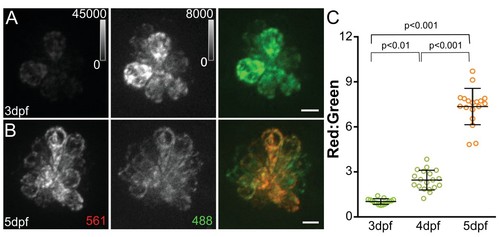
MitoTimer fluorescence ratio increases with neuromast maturation.Maximum projections of hair cells from Tg[myo6b:mitoTimer]w208 fish at 3dpf (A) and 5dpf (B). (C) Mean mitoTimer fluorescence plotted as ratio of red:green at 3, 4, and 5dpf. 3dpf: 1.03 ± 0.05, 4dpf: 2.47 ± 0.66, 5dpf: 7.58 ± 1.2; mean ratio ±SD; n = 15–18 fish. Significance was analyzed by Kruskal-Wallis test with Dunn’s post-test. Value for each fish represents the mean of 2–3 neuromasts. Scale bar = 5 μm. |
Expression Data
| Gene: | |
|---|---|
| Fish: | |
| Anatomical Term: | |
| Stage Range: | Protruding-mouth to Day 5 |
Expression Detail
Antibody Labeling
Phenotype Data
Phenotype Detail
Acknowledgments
This image is the copyrighted work of the attributed author or publisher, and
ZFIN has permission only to display this image to its users.
Additional permissions should be obtained from the applicable author or publisher of the image.
Full text @ Elife