
Fig. S2
- ID
- ZDB-FIG-180914-39
- Publication
- Cantaut-Belarif et al., 2018 - The Reissner Fiber in the Cerebrospinal Fluid Controls Morphogenesis of the Body Axis
- Other Figures
- All Figure Page
- Back to All Figure Page
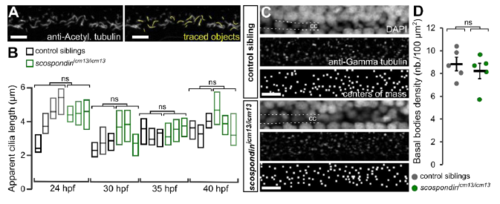
Cilia length and density are unchanged in scospondinicm13/icm13 mutants, related to Figure 2 and Video S1 A. Z projection of a stack of lateral optical sections (depth= 3 ?m) of the spinal cord of a 30 hpf embryo immunostained against Acetylated-tubulin (left) and after tracing to estimate cilia length (yellow). Scale bar represents 10 ?m. B. Cilia length is similar in scospondinicm13/icm13 embryos (green) compared to control siblings (black). (Median � interquartile range, n= 83; 105; 95 and 95 and 67; 96; 94 and 89 cilia at 24; 30; 35 and 40 hpf for control and scospondinicm13/icm13; p = 0.53; 0.14; 0.53 and 0.61, respectively. t= -0.7; -1.8; -0.67 and -0.55, respectively; df = 3.05; 3.4; 3.9 and 2.9, respectively, two-tailed t-test). Each box plot represents a single fish; color intensity reflects the number of measured objects for each fish. Similar results were obtained for scospondinicm15/icm15 embryos (data not shown). C, D. Z projection of stacks of lateral optical sections (depth = 3 ?m) of the spinal cord stained with DAPI and against Gamma-tubulin in a 30 hpf control sibling (top) and scospondinicm13/icm13 curled-down embryo (bottom), allowing to detect basal bodies around the central canal (cc). Centers of mass of detected objects were used to quantify cilia density shown in D as the number of basal bodies per 100 ?m2. n= 5 control (black) and 5 scospondinicm13/icm13 embryos (green). p= 0.52, t= 0.68, df= 8, two-tailed t-test. Each point corresponds to a single fish. Scale bars represent 10 ?m in C. |