Fig. 2
|
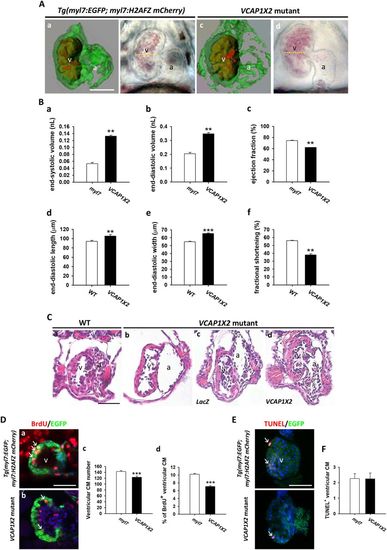
VCAP1X2 mutant displayed cardiac dysfunction and impaired cardiomyocyte proliferation. (A) Pseudodynamic reconstructed 3D images and respective bright-field images are shown of end-diastolic phase beating hearts from Tg(myl7:EGFP; myl7:H2AFZ mCherry) (a,b) or VCAP1X2 mutant (c,d) at 72 hpf. Yellow lines indicate the diameter of the ventricular chamber. Green fluorescence marks ventricular myocardium and red indicates ventricular chamber. Scale bar, 50??m. (B) Parameters related to heart performance were measured from pseudodynamic reconstructed 3D images (a?c, n?=?3, N?=?2) or CCD images (d?f, n?=?20, N?=?3) for Tg(myl7:EGFP; myl7:H2AFZ mCherry) or WT and VCAP1X2 mutant at 72 hpf. End-systolic volume (a) and end-diastolic volume (b) were significantly increased in VCAP1X2 mutant compared with Tg(myl7:EGFP; myl7:H2AFZ mCherry) embryos. Ejection fraction (c) was lower in VCAP1X2 mutant than in Tg(myl7:EGFP; myl7:H2AFZ mCherry) embryos. End-diastolic length (d) and width (e) were increased while fractional shortening (f) was decreased in VCAP1X2 mutant compared to WT. Error bars represent standard error. Student?s t-test, **p?<?0.01, ***p?<?0.001. (C) Paraffin sectioning with hematoxylin and eosin staining revealed a thinner compact layer in the ventricle of VCAP1X2 mutants (b) and LacZ mRNA-injected VCAP1X2 mutants (c) compared to WT (a) or VCAP1X2 mRNA-injected VCAP1X2 mutants (d) (n?=?10 per condition). a, atrium, v, ventricle. Scale bar, 50??m. (D) Immunostaining of BrdU (red) in heart ventricles from Tg(myl7:EGFP; myl7:H2AFZ mCherry) (myl7) (a) or VCAP1X2 mutants (b) at 72 hpf. Significantly decreased cardiomyocyte (CM) number (c) and percentage of BrdU+ CMs (d) in the ventricle was detected in VCAP1X2 mutant compared to Tg(myl7:EGFP; myl7:H2AFZ mCherry) embryos (n?=?20 per condition, N?=?3). Student?s t-test, ***p?<?0.001. Scale bar, 50??m. Apoptotic cells were analyzed by TUNEL labeling (E) and similar low level of apoptotic cells (F) was detected in VCAP1X2 mutant and Tg(myl7:EGFP; myl7:H2AFZ mCherry) embryos (n?=?15, N?=?3). Cardiomyocyte nuclei stained by anti-MEF2 antibody. Error bars represent standard error. Scale bar, 50??m. |
| Fish: | |
|---|---|
| Observed In: | |
| Stage Range: | Protruding-mouth to Day 5 |

