
Fig. 4
- ID
- ZDB-FIG-180713-6
- Publication
- Almeida et al., 2018 - Myelination of Neuronal Cell Bodies when Myelin Supply Exceeds Axonal Demand
- Other Figures
- All Figure Page
- Back to All Figure Page
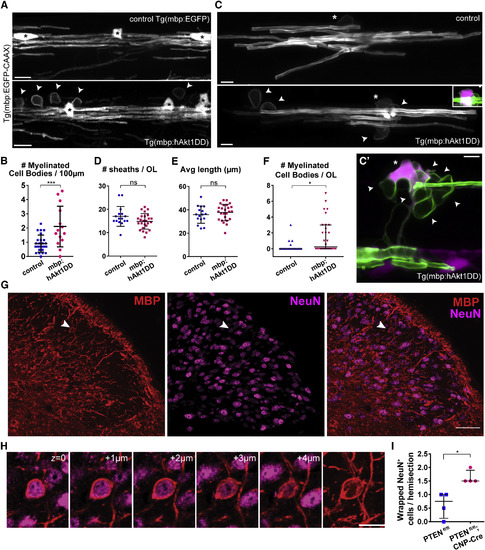
Increasing Myelin Production Induces Cell Body Wrapping in the Zebrafish and Mouse Spinal Cord (A) 5 dpf spinal cord of control and transgenic zebrafish overexpressing constitutively active human Akt1 in oligodendrocytes, Tg(mbp:hAkt1DD), in double oligodendrocyte and myelin reporter line (arrowheads, wrapped cell bodies; asterisks, oligodendrocytes). (B) The number of wrapped cell bodies is significantly increased in Tg(mbp:hAkt1DD) (p = 0.001; n = 25 control and n = 14 Tg(mbp:hAkt1DD); t test). (C–F) Individual oligodendrocytes (C; asterisks note their cell bodies; note cytoplasmic TagRFPt expression in Tg(mbp:hAkt1DD) cell in inset) have a similar myelin sheath number and length at 5 dpf, quantified in (D) (p = 0.077; n = 16 control and n = 25 Tg(mbp:hAkt1DD); t test) and (E) (p = 0.412; n = 16 control and n = 25 Tg(mbp:hAkt1DD); t test), but Tg(mbp:hAkt1DD) animals have more myelinated cell bodies (arrowheads), quantified in (F) (p = 0.011; n = 21 control and n = 30 Tg(mbp:hAkt1DD); Mann-Whitney test). (C’) Another example of an individual oligodendrocyte in Tg(mbp:hAkt1DD) showing ectopic myelination of multiple cell bodies (arrowheads; asterisk denotes oligodendrocyte cell body). (G) Immunostaining of myelin basic protein (red, MBP) and NeuN (magenta) in the dorsal horn of the cervical spinal cord. Arrowhead indicates a wrapped NeuN+ neuronal cell body. (H) Optical sections representing 1-μm increments in the axial plane. Rightmost panel is a maximum intensity projection of MBP. (I) Frequency of ectopic wrapping events is slightly increased in the cervical spinal cord of P30 PTENfl/fl; CNP-Cre transgenic mice (p = 0.029; Mann-Whitney test; n = 4 animals per genotype; each animal quantified as the median of 6 pooled histological sections). All graphs display mean and SD, except for (F) and (I), which display median and interquartile range. The scale bars represent 10 μm (A), 5 μm (C and C’), 1 μm (inset C), 50 μm (G), and 20 μm (H). |
| Genes: | |
|---|---|
| Fish: | |
| Anatomical Terms: | |
| Stage: | Day 5 |
| Fish: | |
|---|---|
| Observed In: | |
| Stage: | Day 5 |