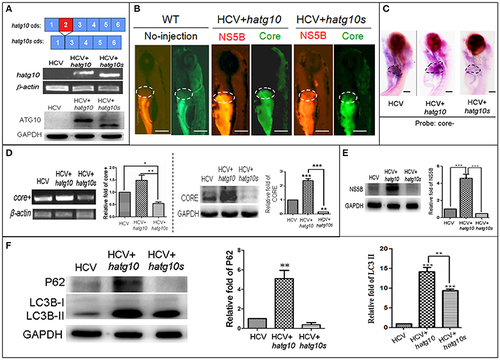
Fig. 4
- ID
- ZDB-FIG-180712-62
- Publication
- Li et al., 2018 - Opposite Effects of Two Human ATG10 Isoforms on Replication of a HCV Sub-genomic Replicon Are Mediated via Regulating Autophagy Flux in Zebrafish
- Other Figures
- All Figure Page
- Back to All Figure Page
|
Different effects of two human autophagy related ATG10 and ATG10S on the HCV subgenomic replication and on autophagy flux in zebrafish larvae. (A) Diagrams show the coding regions of both transcripts of the human atg10 gene exons (upper panel). The HCV model larvae were injected either hATG10 expression vector or hATG10S expression vector separately at 1?4 cell stage and collected at 8 dpf for RT-PCR (middle panel) and western blotting (lower panel) detection. The results identified expression of hATG10 and hATG10S in the HCV subreplicon model zebrafish larvae. (B) Living fluorescence imaging shows variable level of the HCV subreplicon in liver of 5 dpf larvae affected by the two hATG10 isoforms. The green fluorescence represents HCV-core protein and the red fluorescence for HCV NS5B protein. Scale bars represent 280 ?m. (C) WISH was used to detect the replication level of the HCV subreplicon by antisense HCV-core RNA probe (core-) in the three groups of no-ATG10 injected HCV model larvae (HCV), hatg10-injected HCV model larvae (HCV+hatg10) and hatg10s-injected HCV model larvae (HCV+hatg10s). The scales represent 150 ?m. (D) RT-PCR (left panel) and western blotting (right panel) tests indicate the levels of HCV-core+ RNA and CORE protein changed differentially by hATG10 and hATG10S in the HCV model larvae, as compared to the no-ATG10 injected model larvae (8 dpf). ?-actin and GAPDH were used as sample loading controls. The histograms show relative core+/?-actin ratios and CORE/GAPDH ratios, respectively, from three independent tests. Data are expressed as means ± SD. *p < 0.05, **p < 0.01. (E) Western blotting results show the level of HCV NS5B protein regulated differentially by ATG10 and ATG10S in the HCV model larvae, as compared to the no-ATG10 injected model larvae (8 dpf). GADPH was used as a loading control. The histogram shows relative NS5B/GAPDH ratios from three independent tests. Data are expressed as means ± SD. ***p < 0.001. (F) Western blotting results show the levels of LC3B-II/I and p62 proteins being regulated differentially by ATG10 and ATG10S in the HCV model larvae, as compared to the no-ATG10 injected model larvae (8 dpf). GADPH was used as a loading control. The histograms show relative LC3-II/GADPH and P62/GADPH ratios from three independent experiments. Data are expressed as means ± SD. **p < 0.01, ***p < 0.001. |

