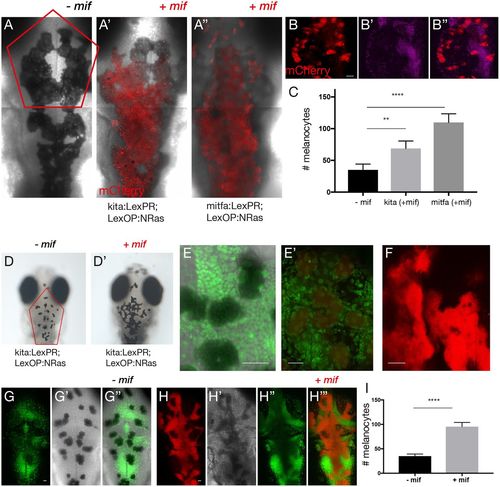
Morphology and proliferative capacity of oncogene-activated melanocytes. (A-A″) Composite images show confocal z-stack projection of the dorsal views of the head of 5-dpf larvae without (A) and with mifepristone-dependent mCherry-NRasQ61K activation (red) in Tg(kita:LexPR-Cerulean;LexOP:mCherry-NRas)ox12 (A′) and Tg(mitfa:LexPR-Cerulean;LexOP:mCherry-NRas)ox130 (A″). The melanocyte-specific expression of mCherry-NRas in transgenic larvae harbouring both a transactivation driver and oncogene effector alleles was activated by addition of 1 μM mifepristone to the embryo rearing solution starting at 24 hpf. (B-B″) Representative image of the procedure used to facilitate counting of melanocytes shows a confocal z-stack projection of melanocytes (red) with a single plane of nuclear stain (magenta). (C) Quantification of the number of melanocytes in the region indicated by the red outline in A, comparing larvae from experimental (+mif) kita:LexPR;LexOP:NRasQ61K (n=8) and mitfa:LexPR;LexOP:NRasQ61K (n=8) to controls (−mif, n=7). Graph shows means±s.e.m. Statistical significance was determined by two-tailed unpaired Student's t-test with Welch's correction. (D,D′) Dorsal views of the head of 12-dpf larvae without (D) and with (D′) mifepristone-dependent mCherry-NRasQ61K activation in Tg(kita:LexPR-Cerulean;LexOP:mCherry-NRas)ox12. (E,E′) Proliferative activity of activated melanocytes (red) (E′) shown with a nuclear stain (green) as compared to controls (E). (F) Confocal z-stack projection of melanocytes (red). (G,H) Representative image of the method used to facilitate counting of melanocytes shows a confocal z-stack projection of melanocytes (red) with a single plane of nuclear stain (green) in the absence (G) and presence (H) of mifepristone. (I) Quantification of the number of melanocytes in the region indicated by the red outline in D, comparing larvae from kita:LexPR;LexOP:NRasQ61K (n=8) with and without oncogene activation (+/−mif). Graph shows means±s.e.m. Statistical significance was determined by two-tailed unpaired Student's t-test with Welch's correction. **P<0.01; ****P<0.0001. Scale bars: (B) 25 μm; (E) 31 μm; (E′) 27 μm; (F) 28 μm; (G) 25 μm and (H) 25 μm.
|
