
Fig. 5
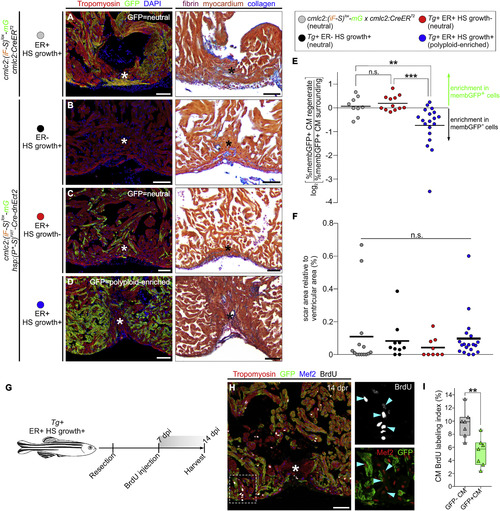
Myocardial Polyploidization Creates a Barrier to Cardiomyocyte Proliferation and Heart Regeneration (A?D) Adjacent sections from 45-dpr hearts from the indicated cohorts, immunostained for Tropomyosin and GFP (left) or stained with AFOG (right). n = 14 (12), 10 (9), 9 (9), and 19 (18) hearts (number of hearts that showed complete regeneration is indicated in parentheses), respectively. Asterisks indicate injured/regenerated area. (E) Relative change in percentage of GFP+ cardiomyocytes in the regenerate compared with the surrounding region in hearts from the indicated cohorts (n = 12, 9, and 19, respectively). ???p < 0.001; ??p < 0.01; Kruskal-Wallis test followed by Dunn's multiple comparisons test. (F) Quantification of the scar area of hearts from (A) to (D) normalized to the ventricular area (n = 14, 10, and 19 hearts; solid black line indicates the mean); n.s., not significant by Kruskal-Wallis test. (G) BrdU pulse-chase strategy used to evaluate cardiomyocyte proliferation during regeneration in experiments from (G) and (H). (H) Section from a 14-dpr mosaic heart composed of diploid (GFP?) and polyploid-enriched (GFP+) cardiomyocyte populations, immunostained for tropomyosin, GFP, Mef2, and BrdU. BrdU and Mef2/GFP signals of boxed region are shown at higher magnifications. Blue arrowheads indicate BrdU+ cardiomyocyte nuclei. Asterisks indicate injured/regenerated area. (I) Cardiomyocyte BrdU labeling indices of GFP? and GFP+ populations in injury sites in experiments from (F) and (G). Box-and-whisker plot. n = 7 hearts. ??p < 0.01, Mann?Whitney test. CM, cardiomyocyte; ER, early recombination; HS, heat-shocked. Scale bars, 50 ?m. See also Figure S6. |
Reprinted from Developmental Cell, 44, González-Rosa, J.M., Sharpe, M., Field, D., Soonpaa, M.H., Field, L.J., Burns, C.E., Burns, C.G., Myocardial Polyploidization Creates a Barrier to Heart Regeneration in Zebrafish, 433-446.e7, Copyright (2018) with permission from Elsevier. Full text @ Dev. Cell