
Fig. 6
- ID
- ZDB-FIG-180608-96
- Publication
- Sala et al., 2017 - MUSCLEMOTION: A Versatile Open Software Tool to Quantify Cardiomyocyte and Cardiac Muscle Contraction In Vitro and In Vivo
- Other Figures
- All Figure Page
- Back to All Figure Page
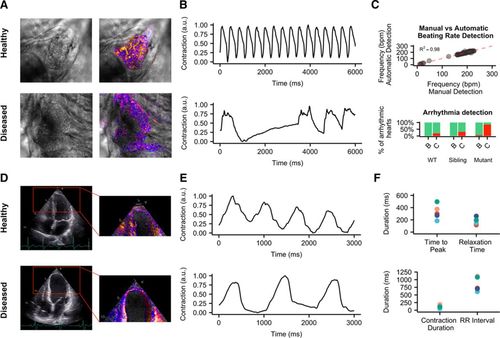
In vivo disease phenotypes. A, Representative examples of wild-type (top) and gnb5a/gnb5b mutant (bottom) zebrafish and relative enhancement of moving pixels. B, Representative qualitative analyses of normal (top) and arrhythmic (bottom) contraction profiles from wild-type and gnb5a/gnb5b mutant zebrafish treated with carbachol. C, Correlation of results obtained from manual (x axis) vs automatic (y axis) detection of beating frequency (top); distribution of normal (green) and arrhythmic (red) contraction patterns in baseline condition (B) and after treatment with carbachol (C) in wild-type and gnb5a/gnb5b mutant zebrafish (bottom). D, Representative echocardiograms of healthy (top) and cardiomyopathic (bottom) human individuals. Ventricles have been manually cropped, and the enhancement of moving pixels is overlaid. E, Representative qualitative analyses of normal (top) and poor (bottom) ventricular functions. F, Quantitative data collected from echocardiogram in 5 individuals. Each color represents 1 individual. |
| Fish: | |
|---|---|
| Condition: | |
| Observed In: | |
| Stage: | Day 5 |