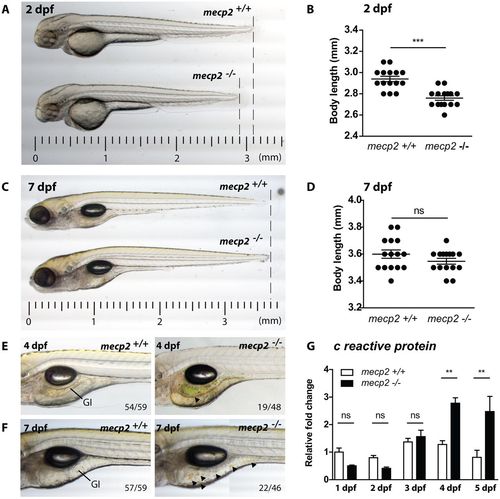
mecp2-deficient zebrafish display inflammation during larval development. (A,C) Representative stereo microscopy images of 2 dpf and 7?dpf wild-type and mecp2-null zebrafish larvae. (B,D) Total body lengths of the 2?dpf and 7?dpf wild-type and mecp2-null larvae, as measured in millimeters (n=15 per condition; Student?s t-test; ***P<0.001; data are representative of three individual experiments). (E,F) Stereo microscopy images of 4?dpf and 7?dpf wild-type and mecp2-null zebrafish illustrating the GI tract phenotypes regularly observed (indicated by arrowheads). The frequency of these phenotypes is shown in relation to the total number of examined animals (19 of 48 mecp2-null animals at 3?dpf; 22 of 46 mecp2-null animals at 7?dpf). (G) qPCR was performed to determine the whole-organism gene expression level of the inflammation marker crp relative to the expression of the housekeeping gene tbp. Wild-type and mecp2-null samples (n=3 with 20 embryos or larvae pooled per sample) were taken every day for the first 5?days of development. The relative fold change versus gene expression in a 1?dpf wild type is shown (one-way ANOVA with Tukey's post hoc test; **P<0.01; ns, not significant; data are representative of two individual experiments).
|

