Fig. 1
- ID
- ZDB-FIG-180309-9
- Publication
- Sanchez et al., 2017 - Whole Genome Sequencing-Based Mapping and Candidate Identification of Mutations from Fixed Zebrafish Tissue
- Other Figures
- All Figure Page
- Back to All Figure Page
|
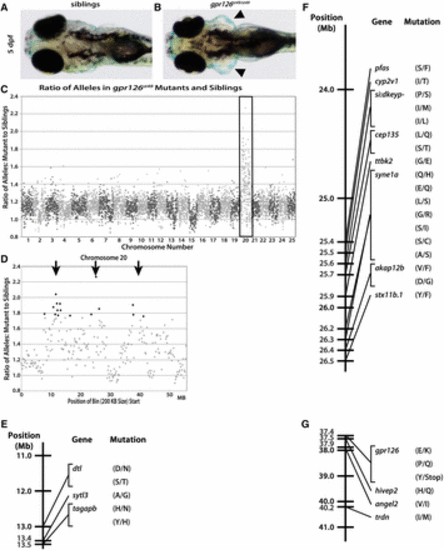
The st49 allele is accurately mapped to chromosome 20 and gpr126 using gDNA extracted from fresh tissue. Dorsal views of phenotypically WT (A) and gpr126st49/st49 (B) zebrafish show the characteristically enlarged ears (arrowheads) of mutants at 5 dpf. (C) When the ratio of variant to reference alleles in the mutant pool is compared to the sibling pool and graphed across the whole genome for gpr126st49, there is a clear spike on chromosome 20 for the gpr126st49 mutation (box). This spike indicates linkage of the region to the trait used to sort the mutant and sibling pools. (D) gpr126st49 is linked to three separate regions on chromosome 20 (arrows). (E?G) Linkage map of the gpr126st49 allele showing the three different regions of chromosome 20 linked to the expanded ear phenotype that was used to sort the mutant and sibling pools. Between all three linked regions there are 29 different protein-coding, homozygous, nonsynonymous SNPs. The single introduced stop is the mutation responsible for the gpr126st49 mutant phenotype. |
| Fish: | |
|---|---|
| Observed In: | |
| Stage: | Day 5 |

