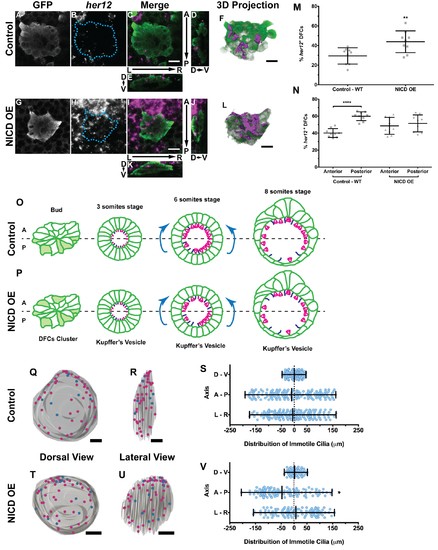
Fig. 5
|
Expression of her12 agrees with future immotile cilia distribution. In situ hybridization with her12 specific probe in sox17:GFP transgenic embryos at bud stage in Control (A?E) and NICD over-expression embryos (G?K). An antibody anti-GFP was simultaneously used in order to highlight the DFCs (A, G). her12 expression visualized with the Fast Red (Roche) fluorescent precipitate (B, H). In all images, scale bar represents 20 ?m. Anterior is to the top and Left is to left. (D?E, J?K) Orthogonal projections emphasising her12 expression in the DFC cluster. (D, J) Anterior is to the top and Dorsal is to left. (E, K) Dorsal is to the top and Left is to left. (M) % her12 positive cells in the DFC cluster in Control (?) and NICD over-expression assay (?). (N) % her12 present in the Anterior or in the Posterior halves of the DFC cluster in Control (?, ?) and NICD over-expression (p, ?). Unpaired t-test with Welsh?s correction; **p<0.01 and ****p<0.0001. (O?P) Models describing how the cellular reorganization that transforms a DFC cluster into a fully mature KV impacts on the position of the immotile cilia in Control (O) and NICD OE (P) embryos. (Q, R, T, U) 3D projections of representative KVs, where the positions of motile (magenta dots) and immotile cilia (blue dots) are shown for Control (Q?R) and NICD OE (T?U). (Q, T) Dorsal view ? Anterior is to the top and Left is to left. (R, U) Lateral view ? Anterior is to the top and Dorsal is to left. In all images, scale bar represents 20 ?m. (S, V) Distribution of the position of the immotile cilia along the three axes: D ? V (Dorsal ? Ventral); A ? P (Anterior ? Posterior); L ? R (Left ? Right), in Control (S) (17 embryos; 159 cilia) and NICD OE (V) (8 embryos; 107 cilia). Distance from centre represents the distance from the origin of the Cartesian referential (placed at the KV?s centre). *p<0.05, Fisher's Exact Test. |

