Fig. 5
- ID
- ZDB-FIG-171206-72
- Publication
- Sheets, 2017 - Excessive activation of ionotropic glutamate receptors induces apoptotic hair-cell death independent of afferent and efferent innervation
- Other Figures
- All Figure Page
- Back to All Figure Page
|
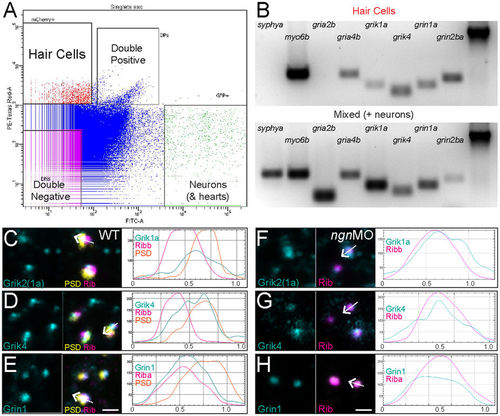
AMPA-, Kainate-, and NMDA-receptor subunits are expressed in zebrafish hair cells. (A) Fluorescence-activated cell sorting: fluorescent scatter was used to separate cell populations according to the fluorescent intensity of mcherry (hair cells) or GFP (neurons and hearts). (B) Gene expression analysis of isolated mcherry-expressing hair cells relative to the GFP-expressing mixed cell population. Gel images were cropped and inverted for display. The presence of myo6b expression was used as a positive control for hair cells and the absence of syphya expression was used as a negative control to ensure the sorted hair cell population was free of neurons. ?-actin (far-right lane) was used as a loading control. Unedited gel images can be found in Supplementary Info. (C?E) Representative max-intensity images of immunolabeled wild-type hair-cell synapses: GluR subunits (cyan), synaptic ribbons labeled with Ribeye (magenta), and PSDs labeled with MAGUK (yellow). The antibody used to detect Grik1a was generated using a conserved region of the C-terminus of human Grik2 that has 92% percentage sequence conservation with zebrafish Grik1a (ClustalW). To the right of each image are corresponding profile plots showing fluorescent signal intensity (y-axis) in relation to distance (x-axis; ?m). The white arrow in each merged image indicates the position and direction of the sampling line used to measure each corresponding profile plot. Note that immunolabel for and Kainate-receptor subunits Grik1a (C) and Grik4 (D) show multiple peak intensities that overlap with both Ribeye and MAGUK, while the NMDA-receptor subunit Gria1a (E) shows a single peak intensity that mostly overlaps with Ribeye. (F?H) Representative max-intensity images of immunolabeled ngn1MO hair-cell synapses. To the right of each image are corresponding profile plots. Note the immunolabel for Grik1a (F), Grik4 (G), and Grin1 (H) is present in the absence of postsynaptic densities and overlaps with synaptic ribbons. Scale bars: 1??m. |
| Genes: | |
|---|---|
| Antibodies: | |
| Fish: | |
| Knockdown Reagent: | |
| Anatomical Terms: | |
| Stage: | Day 5 |

