
FIGURE
Fig. 3
- ID
- ZDB-FIG-171031-6
- Publication
- Vågberg et al., 2015 - X-ray phase-contrast tomography for high-spatial-resolution zebrafish muscle imaging
- Other Figures
- All Figure Page
- Back to All Figure Page
Fig. 3
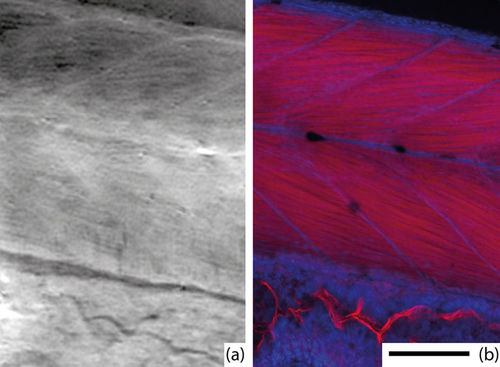
Comparison with histology. (a) A slice from X-ray phase-contrast tomography and (b) epifluorescent confocal microscopy. The images show the approximately same part of the fish. Muscle myofibrils and myosepta are clearly visible in both images. In the X-ray image, brighter corresponds to stronger phase shift, which is approximately proportional to density, whereas the confocal microscopy shows the red-stained myofibrils and blue-stained nuclei. The scale bar is 100 μm and applies to both images. |
Expression Data
Expression Detail
Antibody Labeling
Phenotype Data
Phenotype Detail
Acknowledgments
This image is the copyrighted work of the attributed author or publisher, and
ZFIN has permission only to display this image to its users.
Additional permissions should be obtained from the applicable author or publisher of the image.
Full text @ Sci. Rep.