|
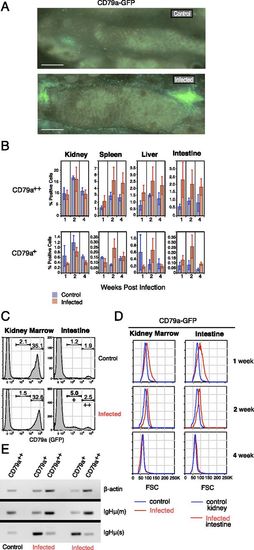
Zebrafish B cell response to bacterial infection with CD79 reduction. (A) Low-power images of intestinal region of PBS control and bacteria injected CD79a-GFP fish at 1 wk postinfection. Scale bars, 1 mm. (B) Percentage of CD79a++ and CD79a+ cells in indicated tissues at 1, 2, and 4 wk postinfection; n = 3 each, mean � SE. (C) Flow cytometry histograms of CD79a++ and CD79a+ cells in kidney and intestine tissue 1 wk postinfection, showing the clear increase in low CD79+ cells in intestine. (D) Increase in size of CD79a+ cells from intestine of infected fish, detected by flow cytometry using forward light scatter (FSC). (E) CD79a+ cells are enriched for secreted IgM compared with CD79a++ cells. RT-PCR analysis of ?-actin, membrane IgH-? (m), and secreted IgH-? (s).
|