
Fig. 3
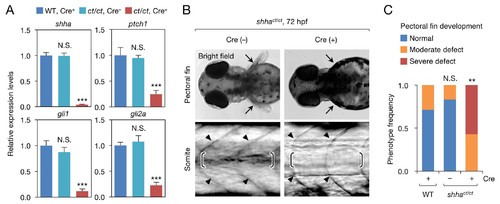
Phenotype of shhact/ct embryos globally expressing Cre. (A) qRT-PCR analysis of 72 hpf Cre+ and Cre− shhact/ct embryos (n = 10 and 9). WT embryos injected with pUbb-iCRE-GFP DNA were used as a control (n = 9). Ten pooled embryos per sample were used for qRT-PCR analysis. The data are presented as the mean ± SEM (***p<0.001, Mann–Whitney U test). (B) Phenotypes of 72 hpf Cre+ and Cre- shhact/ct embryos. Arrows, pectoral fins; arrowheads, somite boundaries; brackets, horizontal myoseptum. Bright field images were captured using an MVX10 microscope. The composite images shown were generated using ImageJ software. Somite defects were observed in all embryos with severe pectoral fin defects. (C) Quantification of pectoral fin phenotypes from the embryos in B (n = 7 [WT, Cre+], n = 12 [shhact/ct, Cre−], and n = 28 [shhact/ct, Cre+]; **p<0.01, Fisher’s exact test). N.S., not significant (p=0.5392). The embryos used in A–C were selected on the basis of their high-level expression of Cre as described in Figure 2—figure supplement 1B (see also Cre DNA and mRNA injection, Materials and methods). A moderate pectoral fin defect was observed in control samples, likely due to injection artifacts. |