
FIGURE
Fig. 10
Fig. 10
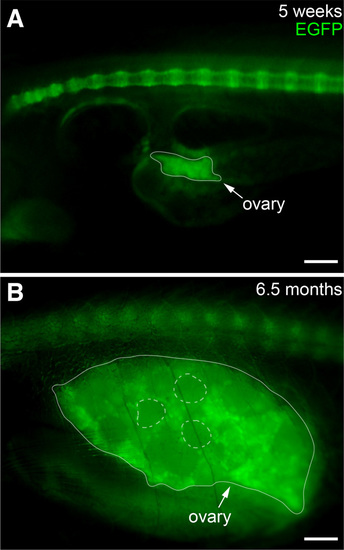
Expression of sox9b:EGFP in ovary Lateral views of juvenile (A) and adult (B) ovary. The ovaries are outlined with a solid line. Examples of mature follicles are outlined with dashed circles. Scale bars, 100 microns. |
Expression Data
| Gene: | |
|---|---|
| Fish: | |
| Anatomical Term: | |
| Stage Range: | Days 30-44 to Adult |
Expression Detail
Antibody Labeling
Phenotype Data
Phenotype Detail
Acknowledgments
This image is the copyrighted work of the attributed author or publisher, and
ZFIN has permission only to display this image to its users.
Additional permissions should be obtained from the applicable author or publisher of the image.
Full text @ Int. J. Dev. Biol.