Fig. 4
- ID
- ZDB-FIG-170620-1
- Publication
- Maskell et al., 2017 - Essential but partially redundant roles for POU4F1/Brn-3a and POU4F2/Brn-3b transcription factors in the developing heart
- Other Figures
- All Figure Page
- Back to All Figure Page
|
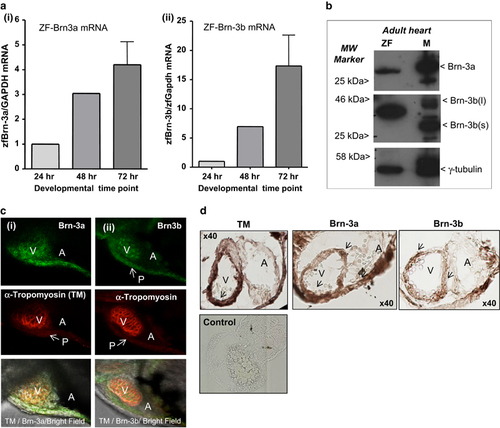
(a) Results of qRT-PCR showing (i) Brn-3a and (ii) Brn-3b mRNA levels in the developing zebrafish at 24, 48 and 72 hpf. cDNA from total RNA was amplified using primers to ZF Brn-3a and Brn-3b and a variation in mRNA levels was corrected using ZF GAPDH. Values were expressed as fold induction relative to expression at 24?h (set at 1). (b) Representative western blot analysis showing single protein band for both Brn-3a and Brn-3b in extracts from adult ZF compared with adult mouse heart (M), used as a positive control. MW markers indicate the protein size and gamma (?) tubulin was used to control for variation in total protein. (c) Representative images showing whole-mount immunostaining for (i) Brn-3a or (ii) Brn-3b (green; top panels) in ZF hearts at 72 hpf. Co-staining with tropomyosin (red; middle panels) indicate cardiomyocytes in the developing heart. Lower panel shows merge with bright field image. V, A, P (indicated by arrow). (d) Representative images of DAB-immunostained ZF embryos sections at 72 hpf. Protein localisation is seen as dark brown staining in ventricles (indicated by arrow), identified by TM, also shows Brn-3a and Brn-3b expression. × 40 magnification. A, atria; hpf, hours post fertilisation; MW, molecular weight; P, pericardial sac; TM, tropomyosin; V, ventricle; ZF, zebrafish heart |
| Genes: | |
|---|---|
| Antibodies: | |
| Fish: | |
| Anatomical Terms: | |
| Stage Range: | Prim-5 to Adult |

