
FIGURE
Fig. 5
Fig. 5
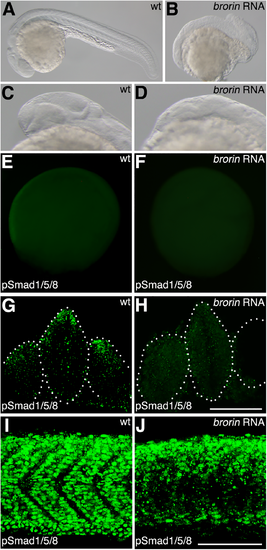
pSmad distribution in brorin RNA-injected embryos. (A-D) Lateral views of wild-type (A, C) and brorin RNA-injected (B, D) embryos at 24 hpf. (E, F) Pattern of pSmad expression in wild-type (E) and brorin RNA-injected (F) embryos at 8 hpf. (G-J) Pattern of pSmad expression in wild-type (G, I) and brorin RNA-injected (H, J) embryos at 24 hpf. G and H are optical cross-sections; I and J are lateral views anterior to the left. Scale bar: 50 ?m. |
Expression Data
Expression Detail
Antibody Labeling
Phenotype Data
Phenotype Detail
Acknowledgments
This image is the copyrighted work of the attributed author or publisher, and
ZFIN has permission only to display this image to its users.
Additional permissions should be obtained from the applicable author or publisher of the image.
Full text @ PLoS One