
Fig. 6
- ID
- ZDB-FIG-170524-16
- Publication
- Albuixech-Crespo et al., 2017 - Molecular regionalization of the developing amphioxus neural tube challenges major partitions of the vertebrate brain
- Other Figures
- All Figure Page
- Back to All Figure Page
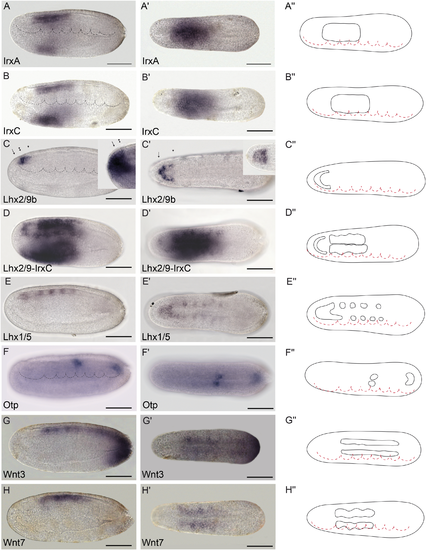
Genoarchitectonic signatures of the hypothalamo-prethalamic primordium (HyPTh) (II). (A-A??) IrxA mRNA expression is observed from the HyPTh/Di-Mesencephalic primordium (DiMes) boundary extending caudally to the rostral portion of the Rhombencephalo-Spinal primordium (RhSp) domain. (B-B??) IrxC mRNA expression is observed from the HyPTh/DiMes boundary, extending caudally to the rostral portion of the RhSp domain. (C-D??) Lhx2/9b marks the alar plate in the Rostral-HyPTh and Intermediate-HyPTh domains (C-C??), as shown by a gap of expression in a double in situ hybridization between Lhx2/9b and IrxC (D-D??). The lateral view of Six3/6 expression (inset in C) is provided for comparison with Lhx2/9b and highlights the restricted expression of Six3/6 to the Rostral-HyPTh (compare the region between the arrow and the single arrowhead, which corresponds to the Rostral-HyPTh and Intermediate-HyPTh domains, with the region between the arrow and double arrowhead, which includes only the Rostral-HyPTh domain (C,C?)). On the other hand, a dorsal view of Fezf (inset in C?) shows expression across both the alar and basal plates of the HyPTh. (E,E??) Lhx1/5 mRNA expression is observed only in the basal plate of the HyPTh and DiMes primordia and in some RhSp subdivisions (see inset in C? for comparison). (F-F??) Otp is a key hypothalamic marker in vertebrates but was only found in amphioxus in one domain at the RhSp region. (G-H??) Wnt3 and Wnt7 mRNAs were detected from the DiMes/RhSp border, extending caudally in the entire RhSp region. Expression patterns correspond to lateral (A-G) or dorsal views (A?-G?) at the 21 h post fertilization (hpf) embryonic stage and are represented in schematics dorsal views (A??-G??). Somites (dotted lines) were used as main landmarks to localize the position of the patterns analyzed in the late neural plate. Scale bar: 50 ?m. |