Fig. 1
- ID
- ZDB-FIG-170505-33
- Publication
- Armstrong et al., 2017 - Shh promotes direct interactions between epidermal cells and osteoblast progenitors to shape regenerated zebrafish bone
- Other Figures
- All Figure Page
- Back to All Figure Page
|
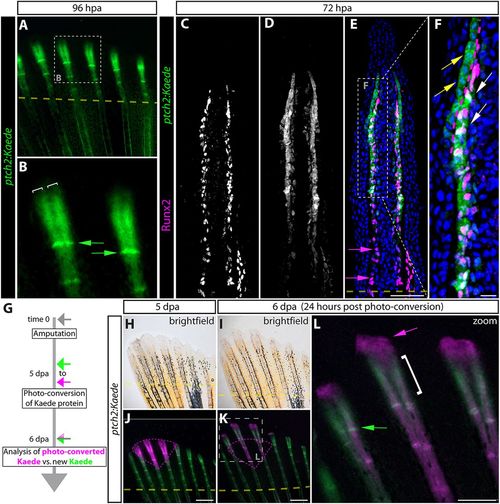
ptch2:Kaede expression and photoconversion reveals transient Hedgehog/Smoothened signaling restricted to distal osteoblast progenitors and basal epidermis during fin regeneration. (A,B) Whole-mount images showing Kaede expression (green) in a 96 hpa fin from a ptch2:Kaede fish. (B) A high-magnification image of the boxed region in A. White brackets mark the split domains of Kaede at the distal end of the regenerate. Green arrows indicate Kaede+ cells at newly re-forming joints. (C-F) Antibody-stained longitudinal fin sections from a 72 hpa ptch2:Kaede fish. Individual Runx2 (C) and Kaede (D) channels are shown in gray scale. Overlay images with Runx2 in magenta and Kaede in green are shown in E and F (a magnification of the boxed region in E). Nuclei are in blue. Yellow arrows indicate Kaede+ basal epidermis; white arrows mark Kaede+/Runx2+ Obs; magenta arrows indicate proximal Runx2+ Obs lacking Kaede. The dotted magenta line indicates the boundary between Kaede+ basal epidermis and pObs. (G) ptch2:Kaede photo-conversion experiment overview. (H-L) Whole-mount bright-field (H,I) and fluorescent (J-L) images of the regenerating caudal fin from a ptch2:Kaede photo-conversion experiment fish. (J) The fin is shown at 5 dpa, immediately after photoconverting Kaede protein in a distal field (tissue marked by the magenta dashed line). (K,L) The same fin 24 h post-conversion (6 dpa) imaged for Kaede expression. The dashed box in K marks the enlarged region in L. Unconverted and new Kaede is green; photo-converted Kaede is magenta. The green arrow marks cells in a forming joint that expressed Kaede within the previous 24 h. The white bracket indicates the narrow distal domain of new Kaede production since photoconversion. The magenta arrow indicates epidermis near the tip of the fin that had displaced distally while retaining photo-converted Kaede. Dashed yellow lines in A,E,J,K show amputation planes. Scale bars: 50 µm in E; 10 µm in F; 500 µm in J,K; 250 µm in L. |

