
FIGURE
Fig. 5
- ID
- ZDB-FIG-170220-4
- Publication
- Park et al., 2016 - Ginsenoside Re Inhibits Osteoclast Differentiation in Mouse Bone Marrow-Derived Macrophages and Zebrafish Scale Model
- Other Figures
- All Figure Page
- Back to All Figure Page
Fig. 5
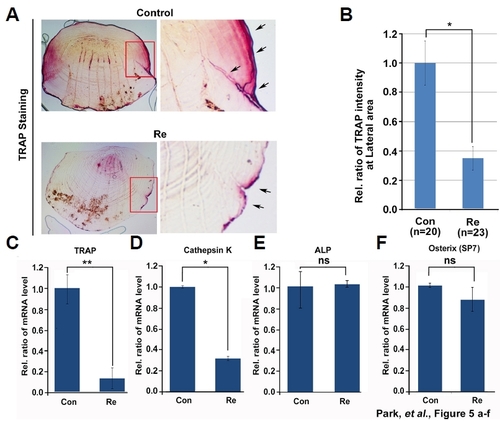
Effect of ginsenoside Re on zebrafish scale osteoclasts. (A) Ginsenoside Re-treated zebrafish scales were stained with TRAP. Red box, magnified X200; arrow, TRAP-positive signal. (B) TRAP signal intensity was measured in lateral regions. Five randomly selected points were measured per treated scale. (C, D) qPCR was performed to determine the mRNA levels of the osteoclast markers |
Expression Data
| Genes: | |
|---|---|
| Fish: | |
| Condition: | |
| Anatomical Term: | |
| Stage: | Days 30-44 |
Expression Detail
Antibody Labeling
Phenotype Data
| Fish: | |
|---|---|
| Conditions: | |
| Observed In: | |
| Stage: | Days 30-44 |
Phenotype Detail
Acknowledgments
This image is the copyrighted work of the attributed author or publisher, and
ZFIN has permission only to display this image to its users.
Additional permissions should be obtained from the applicable author or publisher of the image.
Full text @ Mol. Cells