
Fig. 7
- ID
- ZDB-FIG-170111-7
- Publication
- Mahale et al., 2016 - The Light Intermediate Chain 2 Subpopulation of Dynein Regulates Mitotic Spindle Orientation
- Other Figures
- All Figure Page
- Back to All Figure Page
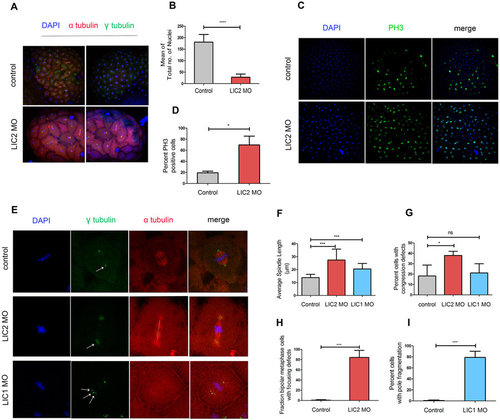
Zebrafish LIC2 depletion leads to mitotic defects in early embryonic divisions. (A) Cytology of blastomeres upon LIC2 depletion. Each representative image shows the top surface view of the embryo at 3.3 hpf, recreated from confocal z-stacks. Control?=?embryos injected with standard control MO. Embryos are stained for microtubules (red), centrosomes (green) and chromosomes (blue). (B) Total average number of nuclei per embryo in surface blastomeres of time-matched embryos (minimum 3 experiments, n?=?10 control and 23 LIC2 depleted embryos). (C) Sum projections of confocal z stacks showing mitotic cells labelled with phosphohistone 3 (PH3, green) and chromatin (DAPI, blue). (D) Fraction of PH3 positive cells upon respective treatment. N?=?23 and 15 embryos respectively for uninjected and LIC2 MO treatment from 2 experiments. (E) Confocal images of surface blastomeres showing longer mitotic spindles (white dotted line), control and unfocused spindle poles (white arrows) and fragmented spindle poles (multiple white arrows) in zLIC1 and zLIC2 morphants. Chromosomes (DAPI, blue), spindle poles (?-tubulin, green) and microtubules (?-tubulin, red) are immunostained as indicated. (F) Average spindle length in surface blastomeres. n?=?139 control cells (30 embryos), 118 metaphase cells for LIC2 depletion (26 embryos) and 52 metaphase cells (10 embryos) for LIC1 depletion, across a minimum 3 experiments each. (G) Fraction of blastomeres showing chromosome congression defects from the embryos in F. (H) Fraction of blastomeres showing spindle pole focusing defects upon LIC2 depletion. n?=?69 control metaphase cells (12 embryos) and 95 metaphase cells (16 embryos) across a minimum of 3 experiments each. (I) Fraction of blastomeres showing spindle pole fragmentation upon LIC1 depletion. n?=?52 metaphase cells (10 embryos) across 3 experiments. Error bars are mean +/??SD. |
| Fish: | |
|---|---|
| Knockdown Reagents: | |
| Observed In: | |
| Stage: | High |