
Fig. S3
- ID
- ZDB-FIG-161219-22
- Publication
- Kaizuka et al., 2016 - An Autophagic Flux Probe that Releases an Internal Control
- Other Figures
- All Figure Page
- Back to All Figure Page
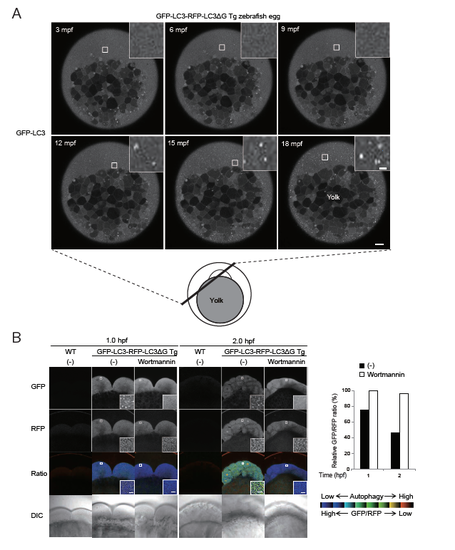
Induction of autophagy in fertilized zebrafish eggs (related to Figure 4) (A) A schematic diagram of a fertilized zebrafish egg and GFP-LC3 signals in a GFP-LC3-RFP-LC3?G transgenic zebrafish egg at the indicated time (min post fertilization (mpf)). GFP-LC3 puncta appeared throughout the egg except for the yolk from approximately 12 mpf. The indicated regions are magnified in the insets. Scale bar, 10 ?m and 1 ?m (insets). (B) Representative fluorescence and DIC images of fertilized eggs of wild-type and GFP-LC3-RFP-LC3?G transgenic zebrafish treated with or without 500 nM wortmannin at 1 and 2 h post fertilization. The graph shows the GFP/RFP fluorescence ratio in the blastomeres as a percentage relative to that of wortmannintreated eggs at 1 hpf. The indicated regions are shown and magnified in the insets. Scale bar, 5 ?m. Data are representative of two independent experiments. |