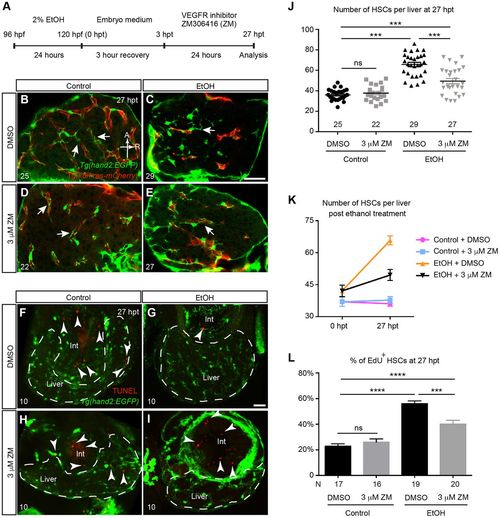
VEGFR inhibition suppressed the increase of HSC cell number post-acute ethanol exposure. (A) Work flow of the ethanol and VEGF receptor (VEGFR) inhibitor treatment. (B-E) Representative confocal single-plane images of Tg(hand2:EGFP;kdrl:ras-mCherry) larvae treated with 0.03% DMSO (B), 2% ethanol followed by DMSO (C), 3??M VEGFR inhibitor ZM (D), and 2% ethanol followed by 3??M ZM (E) at 27?h post-ethanol treatment (hpt). The HSCs are labeled by Tg(hand2:EGFP) expression (green), and the endothelial cells are marked by Tg(kdrl:ras-mCherry) expression (red). Arrows point to the cellular processes of HSCs. Ventral view, anterior is to the top. Sample sizes are indicated. A, anterior; R, right. Scale bar: 50??m. (F-I) Confocal three-dimensional projections of vibratome transverse sections stained by TUNEL assay. The apoptotic cells are shown in red (arrowheads), and the HSCs are labeled by Tg(hand2:EGFP) expression (green). Very few apoptotic cells were present in the livers of all the control and experimental groups, but were frequently seen in the intestine (int). For each group, three liver sections per larva from 10 larvae were analyzed. Dashed line marks the liver. Scale bar: 30??m. (J) Numbers (meanąs.e.m.) of HSCs per liver in each treatment group at 27?hpt. (K) Changes in the numbers (meanąs.e.m.) of HSCs per liver in each treatment group between 0 and 27?hpt. The numbers of animals analyzed are indicated in J and Fig. S1F. (L) Percentages (meanąs.e.m.) of HSCs that incorporated EdU labeling in each treatment group. (J-L) Each experiment was repeated at least three times and the numbers of animals analyzed are shown. Statistical significance in J was calculated by one-way ANOVA and Tukey's post-hoc test; in L it was determined by two-tailed Student's t-test. ***P<0.001; ****P<0.0001; ns, not significant.
|

