
Fig. S3
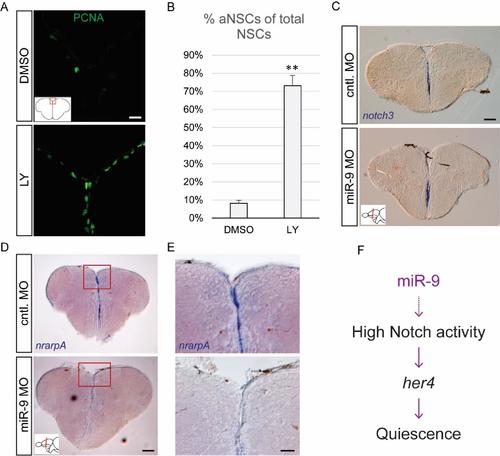
Validation of efficient Notch blockade and effects of miR-9 knock-down on Notch target genes, related to figure 3 (A) Fluorescent immunostaining of PCNA (green) after 48h of Notch inhibition with LY (bottom panel) or the DMSO control (top panel). Scale bar= 20?m. (B) Percentage of activated NSCs (PCNA+/GFAP+) upon LY vs DMSO treatment. n=3 brains per condition; data are represented as mean � 95% CI. (**) p<0.01; one-way ANOVA with Bonferroni post-hoc correction. (C-E) ISH using specific probes for notch3(C) and nrarpA (D, E) 2dpi with the miR-9 MO (bottom panels) or control MO (top panels). Scale bars=100?m (C, D) or 40?m (E). (F) Proposed mechanism of action of miR-9 on quiescence, through potentiating Notch activity in NSCs. |