Fig. 2
- ID
- ZDB-FIG-161116-19
- Publication
- Lim et al., 2016 - Expression of CALR mutants causes mpl-dependent thrombocytosis in zebrafish
- Other Figures
- All Figure Page
- Back to All Figure Page
|
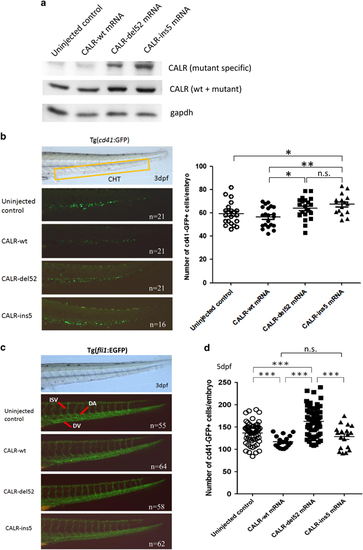
Effects of the expression of mutant CALR on the number of hematopoietic stem/progenitor cells and angiogenesis. (a) CALR protein expression in uninjected, CALR-wt-, CALR-del52- or CALR-ins5-injected embryos at 24 h.p.f. gapdh was used to normalize the total amount of protein in each sample. The expression of human CALR mutant proteins was confirmed in CALR-del52- and CALR-ins5-injected embryos by a customized human CALR mutant-specific polyclonal antibody (top panel). (b) Brightfield image (left panel) of a 3 d.p.f. embryo with a box area indicating caudal hematopoietic tissue where CD41+ cells were counted. Green cells in the darkfield images (left panel) indicated expression of GFP under the control of the cd41 promoter, and were counted and showed on the right panel. (c) The development of dorsal aorta (DA), dorsal vein (DV) and intersegmental vessel (ISV) as indicated by the red arrows (top panel) in uninjected, CALR-wt-, CALR-del52- or CALR-ins5-injected embryos of the Tg(fli1:EGFP) line at 3 d.p.f. (d) The total numbers of CD41+ thrombocytes were counted in uninjected, CALR-wt-, CALR-del52- or CALR-ins5-injected embryos of the Tg(cd41:GFP) line at 5 d.p.f. (the direction of embryos was anterior to the left, dorsal upwards, lateral view; n.s., not significant; *P<0.05, **P<0.01, ***P<0.001; Student t-test). The number of embryos used in each experiment is indicated by ?n? in figures. |

