
Fig. 7
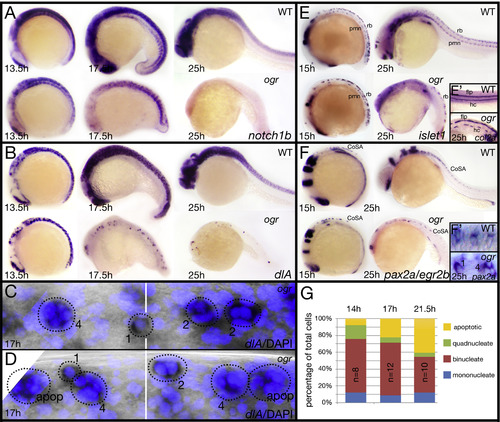
The ogre nervous system lacks later born neurons. (A, B) Expression of: (A) notch1b in proliferating cells and (B) dlA in neuroblasts. (C, D) High magnification view of neuroblasts visualized with dlA and DAPI. Numbers beside circled dlA-positive cells indicate their number of nuclei or if the cell was apoptotic (apop), white bar shows the boundary between somites 3 and 4. (E) Expression of islet1 in primary motoneurons (pmn) and Rohon-Beard sensory neurons (rb). Inset (E′) expression of col2a in floorplate neurons (flp) and hypochord cells (hc). (F) Expression of: pax2a and egr2b in CoSA interneurons (CoSA) and inset (F′) high magnification of CoSA interneurons. Numbers beside cells indicate their number of nuclei. (G) Quantification of multinucleate neuroblasts between somites 2 and 8; n indicates the number of embryos at different stages. Differences are significant compared between 14 h and 17 h (p<0.001) and compared between 17 h and 21.5 h (p<0.05; contingency tables/Pearson′s chi square). |
| Genes: | |
|---|---|
| Fish: | |
| Anatomical Terms: | |
| Stage Range: | 5-9 somites to Prim-5 |
| Fish: | |
|---|---|
| Observed In: | |
| Stage Range: | 5-9 somites to Prim-5 |
Reprinted from Developmental Biology, 418(2), Warga, R.M., Wicklund, A., Richards, S.E., Kane, D.A., Progressive loss of RacGAP1/ogre activity has sequential effects on cytokinesis and zebrafish development, 307-22, Copyright (2016) with permission from Elsevier. Full text @ Dev. Biol.