
Fig. 4
- ID
- ZDB-FIG-160831-12
- Publication
- Xu et al., 2016 - Microglia Colonization of Developing Zebrafish Midbrain Is Promoted by Apoptotic Neuron and Lysophosphatidylcholine
- Other Figures
- All Figure Page
- Back to All Figure Page
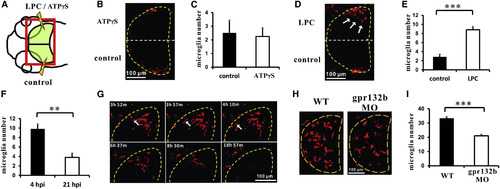
LPC Promotes the Entry of Microglial Precursors into the Brain (A) A schematic diagram of the dorsal view of zebrafish head. The red square indicates the region where LPC or ATPγS is injected. Normally the upper half-brain and lower half-brain are injected with LPC or ATPγS and control buffer, respectively. (B) Dorsal view of the ATPγS-injected brain of Tg(Xla.Tubb:bcl-2;mpeg1:loxP-DsRedx-loxP-GFP) embryos at 4-5 hpi. The upper half-brain is injected with ATPγS and the lower half-brain is injected with control buffer. DsRedx+ cells represent microglia. The midbrain is labeled by dashed lines. (C) Quantification of microglia in ATPγS-injected brain of Tg(Xla.Tubb:bcl-2;mpeg1:loxP-DsRedx-loxP-GFP) embryos at 4-5 hpi. n = 8 for control and ATPγS injection. DsRedx+ cells represent microglia. Error bars represent the mean � SEM. (D) Dorsal view of the LPC-injected brain of Tg(Xla.Tubb:bcl-2;mpeg1:loxP-DsRedx-loxP-GFP) embryos at 4-5 hpi. The upper half-brain is injected with LPC and the lower half-brain is injected with control buffer. DsRedx+ cells represent microglia. White arrows indicate LPC-induced microglia in the brain. The midbrain is labeled by dashed lines. (E) Quantification of microglia in the LPC-injected brain of Tg(Xla.Tubb:bcl-2;mpeg1:loxP-DsRedx-loxP-GFP) embryos at 4-5 hpi. n = 17 for control and LPC injection. Error bars represent the mean � SEM. ***p < 0.001. (F) Quantification shows that the number of microglia in the LPC-injected brain of Tg(Xla.Tubb:bcl-2;mpeg1:loxP-DsRedx-loxP-GFP) embryos is drastically decreased by 21 hpi. DsRedx+ cells represent microglia. n = 5. Error bars represent the mean � SEM. **p < 0.01. (G) Time-lapse imaging pictures show that the microglia in the LPC-injected brain of Tg(mpeg1:loxP-DsRedx-loxP-eGFP) embryos gradually migrate out of the brain. DsRedx+ cells represent microglia. White arrowheads indicate one microglia migrating out of the brain. Dashed lines indicate the midbrain. (H) Dorsal view images of the midbrain of Tg(mpeg1:loxP-DsRedx-loxP-eGFP) control and gpr132b morphants (MO). DsRedx+ cells represent microglia. Dashed lines indicate the midbrain. (I) Quantification of the number of microglia number in the midbrain of Tg(mpeg1:loxP-DsRedx-loxP-eGFP) control and gpr132b morphants (MO). n = 14 for WT control and n = 15 for MO. Error bars represent the mean � SEM. ***p < 0.001. See also Figure S4 and Movie S4. |
| Gene: | |
|---|---|
| Fish: | |
| Condition: | |
| Knockdown Reagent: | |
| Anatomical Terms: | |
| Stage: | Protruding-mouth |
| Fish: | |
|---|---|
| Condition: | |
| Knockdown Reagent: | |
| Observed In: | |
| Stage: | Protruding-mouth |
Reprinted from Developmental Cell, 38(2), Xu, J., Wang, T., Wu, Y., Jin, W., Wen, Z., Microglia Colonization of Developing Zebrafish Midbrain Is Promoted by Apoptotic Neuron and Lysophosphatidylcholine, 214-22, Copyright (2016) with permission from Elsevier. Full text @ Dev. Cell