
Fig. 7
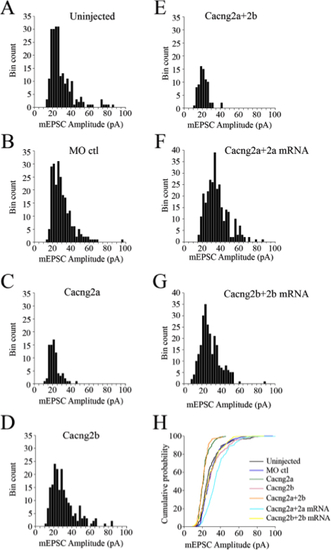
Amplitude distributions of mEPSCs obtained from control and morphant embryos. Example of amplitude distributions of mEPSCs recorded from (A) an uninjected embryo (n=219 events, bin width=2.5 pA). (B) A MO control injected embryo (n=234 events, bin width =2.5 pA). (C) A Cacng2a MO injected embryo (n = 78 events, bin width =2.5 pA). (D) A Cacng2b MO injected embryo (n =202 events, bin width=2.5 pA). (E) A Cacng2a+2b MO injected embryo (n=76 events, bin width=2.5 pA). (F) A Cacng2a MO +Cacng2a mRNA injected embryo (n = 164 events, bin width=2.5 pA). (G) A Cacng2b MO+Cacng2b mRNA injected embryo (n=132 events, bin width = 2.5 pA). (H) Cumulative histogram of the peak amplitude of AMPA mEPSCs from A to E. Note that the cumulative histograms from Cacng2a and Cacng2a+2b morphants are noticeably different from the uninjected controls, MO controls and Cacng2b MO recordings, which group together. |