Fig. 4
- ID
- ZDB-FIG-160420-6
- Publication
- Stiff et al., 2016 - ATR promotes cilia signalling; links to developmental impacts
- Other Figures
- All Figure Page
- Back to All Figure Page
|
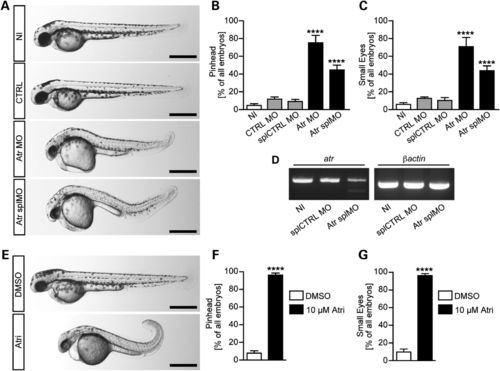
Morphological changes caused by Atr depletion in zebrafish. (A) Live images of 48 hpf zebrafish embryos. As controls, zebrafish were either left uninjected (NI) or control injected (CTRL) with a standard control MO (CTRL MO) or a 5 base mismatch MO (splCTRL MO), respectively. To generate Atr loss of function, injections with a translation blocking MO against Atr (Atr MO) or an MO interfering with Atr splicing (Atr splMO) were performed. Scale bars: 500 µm. (B) The percentage of embryos with an underdeveloped head. Graph displays mean values ± SEM, and n = 111-193 embryos in 5-11 experiments. ****P < 0.0001, one-way ANOVA. (C) Loss of Atr interferes with regular eye development. Graph displays means ± SEM, and n = 93-113 embryos in 5-11 experiments. ****P < 0.0001, one-way ANOVA. (D) Representative images of RT-PCR experiments assessing splice blocking efficiency of Atr splMO compared with controls. Left panel shows PCR of exons 2-4 of atr with a weaker band at the expected size and an additional smaller band representing the mis-spliced product upon Atr splMO injection. Right panel shows a PCR fragment of βActin as loading control. (E) Live images of zebrafish embryos (48 hpf) treated with either 1% DMSO or 10 µm Atr inhibitor (ATRi-1) from the tailbud stage on. Scale bars: 500 µm. (F) Inhibition of Atr by chemical means (ATRi-1) results in a similar reduction of the head size of 48 hpf embryos. Graph displays mean values ± SEM, and n = 95-217 embryos in five experiments. P < 0.0001, Student′s t-test. (G) The percentage of embryos developing smaller eyes upon Atr inhibition. Results show the mean values ± SEM, and n = 95-217 embryos in five experiments. P < 0.0001, Student′s t-test. |
| Fish: | |
|---|---|
| Condition: | |
| Knockdown Reagents: | |
| Observed In: | |
| Stage: | Long-pec |

