
Fig. 1
- ID
- ZDB-FIG-160205-96
- Publication
- Chang et al., 2016 - Zebrafish cerebrospinal fluid mediates cell survival through a retinoid signaling pathway
- Other Figures
- All Figure Page
- Back to All Figure Page
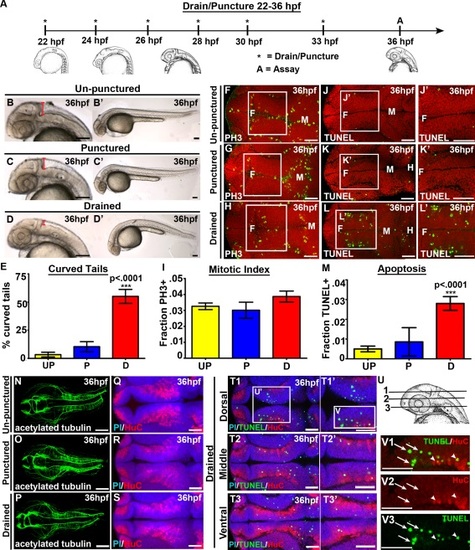
CSF promotes cell survival and tail extension. (A) Experimental design. Drainage/puncture (*) occurred every 2 hours from 22 to 36 hpf. Embryos were assayed (A) at 36 hpf. (B–D) Brightfield lateral view of unpunctured (B), punctured (C), and drained (D) embryos. (B′–D′) Whole embryo phenotype. (E) Percent of embryos with curved tails. (F–H) Dorsal view of PH3 (green) and (J–L) TUNEL (green). Propidium iodide in red. (F-H; J-L) white box indicates region quantified. (J′,K′L′) Magnified image of region indicated by white box in J,K,L. (I,M) Quantification of the fraction of PH3 (I) and TUNEL (M) positive cells. (N–P) Dorsal view of acetylated tubulin (green) or (Q–S) HuC (red) and propidium iodide (blue). (T) Dorsal/ventral sections of neural tube (T1-3) stained with TUNEL (green), HuC (red) and propidium iodide (blue). (U) Representative dorsal/ventral sections of neural tube shown in T. 1-3 correspond to T1-T3. (V) Magnified image of TUNEL and HuC (V1), HuC alone (V2) and TUNEL alone (V3) from dorsal section of diencephalon (T1). (N-S) projection overlaid on single slice of propidium iodide image, all other images are a single 0.6 µm slice. Data represented as mean ± SEM. F= forebrain, M = midbrain. UP = unpunctured, P = punctured, D = drained. Scale bars = 50 µm. |