
Fig. 1
- ID
- ZDB-FIG-150831-14
- Publication
- Nath et al., 2015 - PTPMT1 Inhibition Lowers Glucose through Succinate Dehydrogenase Phosphorylation
- Other Figures
- All Figure Page
- Back to All Figure Page
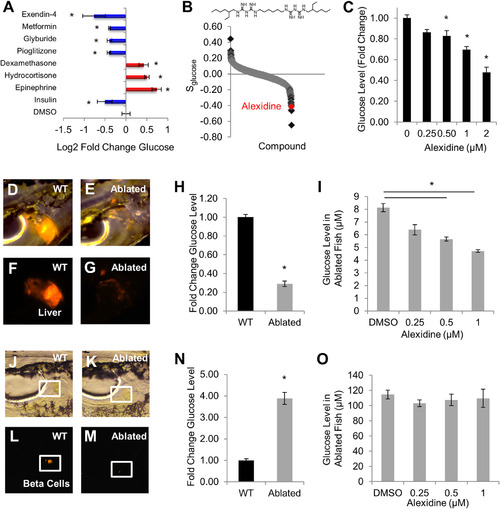
In Vivo Chemical Screen for Modifiers of Glucose Levels Identifies Alexidine as a Glucose-Lowering Agent (A) Measurement of glucose levels in larval zebrafish after treatment with known hyper- and hypoglycemic agents (n = 3). (B) S-score (log ratio of the fold change in glucose levels) ranking of the glucose-lowering ability of compounds in the Prestwick library. Alexidine?s score is depicted in red, and its chemical structure is shown on the graph. (C) Alexidine dose-response curve (n = 5). (D?G) Bright-field (D and E) and fluorescent (F and G) images of wild-type livers (D and F) and ablated livers (E and G). (H) Glucose measurements in larvae with wild-type livers versus ablated livers. (I) Glucose measurements in alexidine-treated larvae with ablated livers (n = 3). (J?M) Bright-field (J and K) and fluorescent (L and M) images of wild-type (J and L) β cells and ablated β cells (K and M). (N) Glucose measurements in larvae with wild-type β cells versus ablated β cells. (O) Glucose measurements in alexidine-treated larvae with ablated β cells (n = 3). Data are presented as mean � SEM. p < 0.01. See also Figure S1. |
| Gene: | |
|---|---|
| Fish: | |
| Condition: | |
| Anatomical Terms: | |
| Stage Range: | Day 5 to Days 7-13 |
| Fish: | |
|---|---|
| Condition: | |
| Observed In: | |
| Stage Range: | Day 5 to Days 7-13 |