
FIGURE
Fig. S3
- ID
- ZDB-FIG-150616-12
- Publication
- Dalgin et al., 2015 - Differential levels of Neurod establish zebrafish endocrine pancreas cell fates
- Other Figures
- All Figure Page
- Back to All Figure Page
Fig. S3
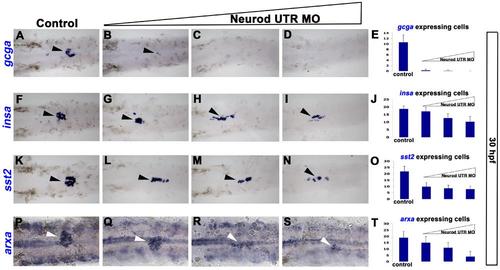
Dorsal bud endocrine cell types display differential sensitivity to Neurod knockdown. In situ hybridization for glucagon (gcga, A-D), insulin (insa, F-I), somatostatin2 (sst2, K-N) and aristaless related homeobox a (arxa, P-S) at 30 hpf. Control (A, F, K, P), Neurod UTR MO 2 ng (B, G, L, Q), 4 ng (C, H, M, R) or 8 ng (D, I, N, S) injected specimens. Mean (± s.d.) number of cells expressing gcga (E), insa (J), sst2 (O) and arxa (T) from four independent experiments and from a minimum of 20 embryos per group. Arrowheads indicate dorsal bud endocrine cells. |
Expression Data
Expression Detail
Antibody Labeling
Phenotype Data
Phenotype Detail
Acknowledgments
This image is the copyrighted work of the attributed author or publisher, and
ZFIN has permission only to display this image to its users.
Additional permissions should be obtained from the applicable author or publisher of the image.
Reprinted from Developmental Biology, 402(1), Dalgin, G., Prince, V.E., Differential levels of Neurod establish zebrafish endocrine pancreas cell fates, 81-97, Copyright (2015) with permission from Elsevier. Full text @ Dev. Biol.