Fig. 9
- ID
- ZDB-FIG-150430-9
- Publication
- Wen et al., 2013 - Synchronous and asynchronous modes of synaptic transmission utilize different calcium sources
- Other Figures
- All Figure Page
- Back to All Figure Page
|
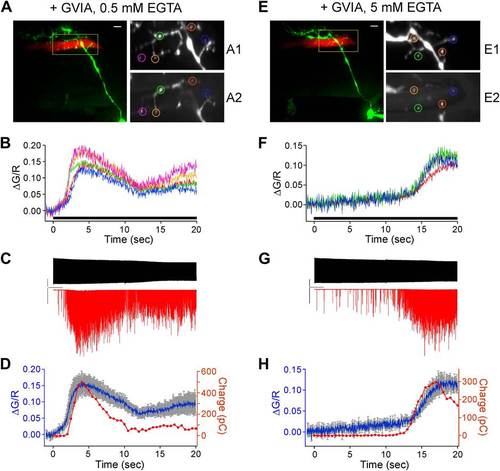
Simultaneous paired recordings and calcium imaging in ω-conotoxin GVIA-treated fish. The examples shown compare the effects of 0.5 mM (A-D) vs 5 mM (E-H) intracellular EGTA. (A) and (E) Image of the CaP dye filled with Alexa Fluor 647 (green) and target muscle filled with Alexa Fluor 555 (red). Multiple synaptic boutons contacting the target muscle cell are visible as yellow varicosities (scale bar = 10 Ám). An enlarged view of the fill (A1 and E1) and peak Fluo-5F calcium response (A2 and E2) are shown for the color coded boutons. (B) and (F) The associated ?G/R plots for each of the boutons in A and E as a function of time during 20 s, 100 Hz stimulus (indicated by black bar), which began at time 0. (C) and (G) The associated patch clamp recording showing the motor neuron action potential (top) and postsynaptic EPCs (bottom) during the 20 s, 100 Hz stimulation. The scale bars correspond to 40 mV, 1 nA, and 2 s. (D) and (H) An overlay plot showing the coincidence between the onset of the mean ?G/R fluorescence for all ROIs (blue with gray SD) and the onset of asynchronous release (red). Release was shown as integrated synaptic charge entry for each consecutive half-second of stimulation. |

