
Fig. 1
- ID
- ZDB-FIG-150407-13
- Publication
- Arnold et al., 2015 - Comparative analysis of genes regulated by Dzip1/iguana and Hedgehog in zebrafish
- Other Figures
- All Figure Page
- Back to All Figure Page
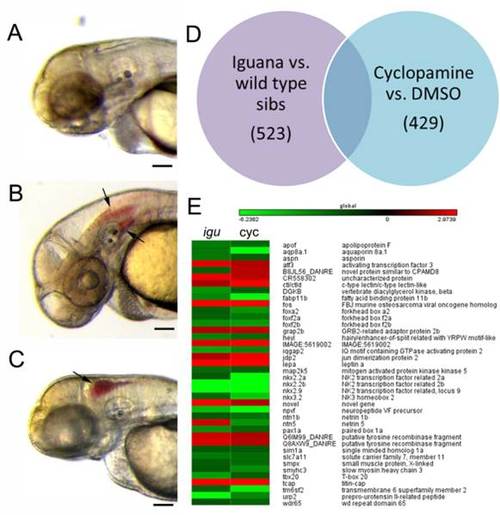
Summary of genes with significantly altered expression in igu mutants and cyclopamine-treated embryos. A?C: Phenotypes of wild-type (A), igu mutant (B) and cyclopamine-treated wild-type (C) embryos at 48 hpf. Arrows point to hemorrhages. Scale bar = 100 �m. D: Venn diagram of total genes significantly up- or down-regulated in treatment group as compared to their control. The purple circle represents the comparison of igu mutants and wild-type siblings and the blue circle represents the comparison of cyclopamine-treated to DMSO-treated siblings. The overlap represents 40 annotated genes that were changed in both groups. E: Heat map of 40 genes differently expressed in both igu mutant and cyclopamine-treated embryos. Green indicates down-regulation, and red indicates up-regulation. Values on scale bar indicate range of fold changes from 6.2-fold down-regulated to 2.1-fold up-regulated. igu, iguana mutant; cyc, cyclopamine-treated. |
| Fish: | |
|---|---|
| Condition: | |
| Observed In: | |
| Stage: | Long-pec |