Fig. 4
- ID
- ZDB-FIG-150114-2
- Publication
- Sharaby et al., 2014 - Gas2l3 Is essential for brain morphogenesis and development
- Other Figures
- All Figure Page
- Back to All Figure Page
|
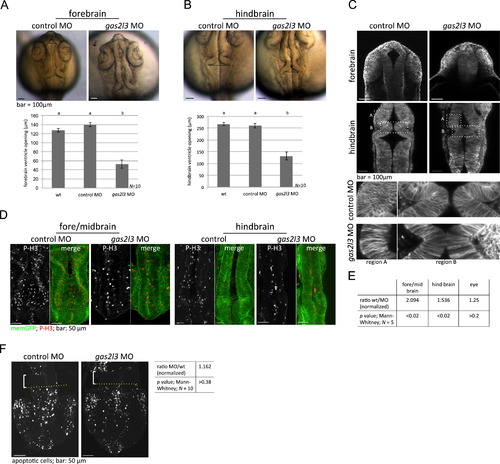
Abnormal brain ventricles and proliferation in Gas2l3-knockdown embryos. (A and B) One-cell stage embryos were injected with 2 pmol gas2l3 or standard control MO. Images of the forebrain (A) and hindbrain (B) were taken 24 hpf using a stereomicroscope Leica M165 FC (representative images are depicted). Fore- and hindbrain maximal ventricle opening was measured using ImageJ software (black dotted lines). Results are shown as mean (N=10)ąSEM. Different letters indicate significant differences (ANOVA, Bonferroni, p<0.001, df=2, 27). (C) One-cell stage embryos were injected with 2 pmol gas2l3 or standard control MO and 100 pg CAAX-GFP mRNA. Images of the forebrain (left) and mid- and hindbrains (right) were taken at 24 hpf (upper panels; representative images are depicted). Matching regions (A and B) of the mid- and hindbrain of the control and gas2l3 knockdown embryos are magnified for better visualization (lower panels). (D) One-cell-stage embryos were treated as described in (C). At 24 hpf, embryos were fixed and processed for whole-mount immunostaining with anti-phosphorylated histone H3 antibodies (P-H3). Z-sections covering either the fore/midbrain or hindbrains (x,y) and the complete dorsal ventral axis (z) were taken. Representative images are depicted (E). The number of mitotic cells in the two brain sections was derived from the mid z-section of control embryos and gas2l3 morphants (N=5). This number was normalized to the corresponding tissue area to calculate mitotic indexes. A similar approach was used to determine the mitotic index of the eye. Average mitotic index ratios between control embryos (wt) and morphants (MO) are shown for the 2 brain sections, as well as for the eye. A statistically significant reduction in the mitotic index was observed in the brain of gas2l3 morphants, but not in their eyes (Mann-Whitney U test). (F) TUNEL assay was performed on fixed 24 hpf embryos injected withgas2l3- or control-MO. The average apoptotic-index ratio between the two groups is shown (N=10). The Mann-Whitney U test was used. We used Zeiss LSM780 upright confocal microscope, and a 20× lens for imaging (C, D and F). |
| Fish: | |
|---|---|
| Knockdown Reagent: | |
| Observed In: | |
| Stage: | Prim-5 |
Reprinted from Developmental Biology, 394(2), Sharaby, Y., Lahmi, R., Amar, O., Elbaz, I., Lerer-Goldshtein, T., Weiss, A.M., Lior, A., Tzur, A., Gas2l3 Is essential for brain morphogenesis and development, 305-13, Copyright (2014) with permission from Elsevier. Full text @ Dev. Biol.

