Fig. 2
- ID
- ZDB-FIG-141216-2
- Publication
- Paardekooper Overman et al., 2014 - Phosphoproteomics-Mediated Identification of Fer Kinase as a Target of Mutant Shp2 in Noonan and LEOPARD Syndrome
- Other Figures
- All Figure Page
- Back to All Figure Page
|
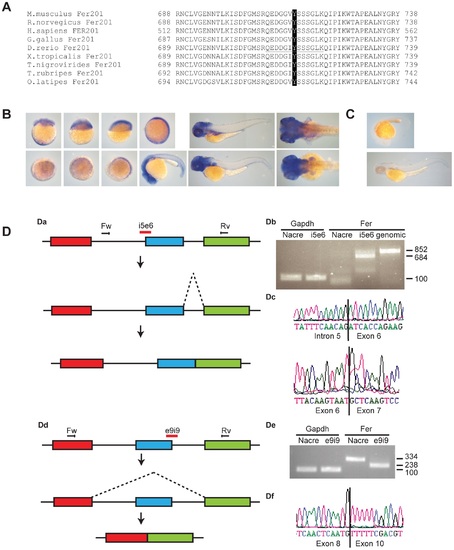
Fer expression in zebrafish embryos and Fer MO induced splicing defects. A. Alignment of zebrafish Fer kinase sequence encompassing the autophosphorylation site (black) that was identified by phosphoproteomics with the mammals M. musculus, R. norvegicus, H. sapiens, the avian G. gallus, the amphibian Xenopus tropicalis, and the fish Tetraodon nigrovirides, Takifugu rupripes and Oryzias latipes. B. fer expression during the first 24 hpf and at 3 dpf and 4 dpf was observed using in situ hybridization with an antisense fer probe. C. ISH with negative control sense fer probe. D. RT-PCR showing altered splicing of fer in MO injected embryos. Da. Model of altered splicing by Fer MO i5e6. Exons 5, 6 and 7 are indicated in red, blue and green, respectively. Primers used for RT-PCR are indicated as arrows. MO is indicated in red. Due to splice blocking, intron 5 is not spliced out of the processed mRNA. Db. RT-PCR showing gapdh control in Nacre (control) MO and Fer MO injected embryos. RT-PCR showing Fer product in Nacre control MO and Fer i5e6 MO injected embryos, and genomic DNA as a positive control. Dc. Sanger sequencing showing the inclusion of intron 5 and the normal splicing of exon 6 in the RT-PCR product. Dd. Model of altered splicing by Fer MO e9i9. Exons 8, 9 and 10 are indicated in red, blue and green, respectively. Primers used for RT-PCR are indicated as arrows. MO is indicated in red. Due to defective splicing, exon 9 is spliced out of the processed mRNA. De. RT-PCR showing gapdh control in Nacre (control) MO and Fer e9i9 MO injected embryos. RT-PCR showing Fer product in Nacre control MO and Fer e9i9 MO injected embryos with a decrease in size of the product in e9i9 MO injected embryos. Df. Sanger sequencing showing the exclusion of exon 9. |
| Gene: | |
|---|---|
| Fish: | |
| Anatomical Terms: | |
| Stage Range: | 8-cell to Day 4 |

