
Fig. 6
- ID
- ZDB-FIG-141020-10
- Publication
- Fjose et al., 1994 - Expression of the zebrafish gene hlx-1 in the prechordal plate and during CNS development
- Other Figures
- All Figure Page
- Back to All Figure Page
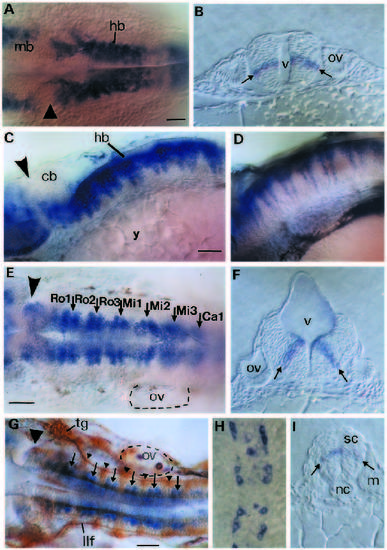
Analysis of hlx-1 expression during cell differentiation in the hindbrain and spinal cord. A and B show dorsal views and cross-sections of the hindbrain in a 22 hpf embryo, respectively. The arrows in picture B indicate the location of the bilateral columns of hlx-1- expressing cells. Large arrowheads in A,C,E and G indicate the location of the furrow at the midbrain-hindbrain border. C and D are side views of the hindbrain of hlx-1-stained 30 and 45 hpf embryos, respectively. E and F show dorsal view and cross-section of the hindbrain in 30 hpf embryos labelled with the hlx-1 probe. In E the location of the individual rhombomeres are shown and the predicted segment borders are indicated by arrows. The arrows in F mark the dorsoventral location of the transversal hlx-1 stripes. (G) Dorsal view of the hindbrain of a 30 hpf embryo double labelled with hlx-1 and zn-12. Arrowheads mark the position of segmentally arranged clusters of reticular neurons and arrows indicate the predicted rhombomere borders. H and I show dorsal view and cross-section of the anterior spinal cord in a 22 hpf embryo. The two arrows in I indicate the dorsoventral location of the bilateral columns of hlx-1-expressing cells. Bar, 30 �m. Abbreviations: cb, cerebellum; hb, hindbrain; llf, lateral longitudinal fascicle; m, myotome; mb, midbrain; nc, notochord; ov, otic vesicle; sc, spinal cord; tg, trigeminal ganglia; v, fourth ventricle; y, yolk; Ro1-Ca1, abbreviations for rhombomeres 1-7. |
| Gene: | |
|---|---|
| Antibody: | |
| Fish: | |
| Anatomical Terms: | |
| Stage Range: | 26+ somites to High-pec |