
Fig. 4
- ID
- ZDB-FIG-140522-66
- Publication
- Almeida et al., 2014 - Spectrum of Fates: a new approach to the study of the developing zebrafish retina
- Other Figures
- All Figure Page
- Back to All Figure Page
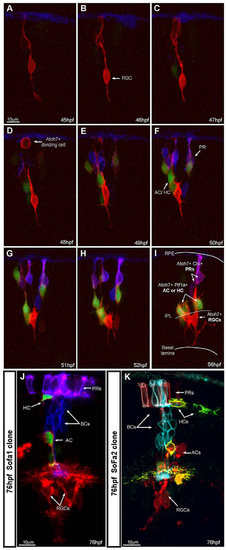
SoFa lines allow precise identification of cell fate within developing clones. (A-I) Time lapse series of a developing SoFa1 clone in an unlabelled wild-type host. We presume this clone arose from a single progenitor cell due to its final size. Imaging started at <45 hpf, corresponding to the time of the appearance of the first gapRFP-expressing cells (Atoh7+) and image stacks were collected every hour. Some Atoh7+ cells differentiate into RGCs, whereas others divide and start expressing gapCFP (Crx+) or cytGFP (Ptf1a+). At the onset of differentiation, it is possible to identify the final fate of these cells before they reach their final position: RGCs (red cells expressing increasing levels of gapRFP, arrow), inhibitory neurons (red and green cells), PRs (purple cells). Crx+ BCs did not yet arise through the duration of the movie: <12 h time-lapse movie; extended focus confocal image, z stack=25.5 µm; step size=1.5 µm. (J,K) Examples of SoFa clones at 76 hpf, when all cell types have differentiated and show their characteristic laminar position in the retina. (J) SoFa1: PRs ( purple); BCs (blue); AC/dAC/HC (red and green); RGCs (red); single confocal image. (K) A SoFa2 clone: PRs (cyan and red); BCs (cyan); AC/dAC/HC (red and yellow); RGCs (red); 3D projection, z stack=40 µm, step size=2 µm. |