
FIGURE
Fig. S5
Fig. S5
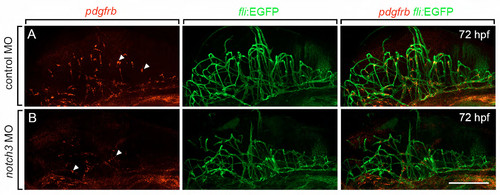
notch3 MO phenocopied the pericyte deficit phenotype in notch3fh332 mutant larvae. (A,B) Fluorescent ISH showing pdgfrb+ brain pericytes in 72 hpf control and notch3 MO-injected larvae. Arrowheads, pdgfrb+ pericytes. Scale bar, 200 μm. |
Expression Data
Expression Detail
Antibody Labeling
Phenotype Data
Phenotype Detail
Acknowledgments
This image is the copyrighted work of the attributed author or publisher, and
ZFIN has permission only to display this image to its users.
Additional permissions should be obtained from the applicable author or publisher of the image.
Full text @ Development