
Fig. S8
- ID
- ZDB-FIG-140114-42
- Publication
- Xu et al., 2013 - Stimulation of mTORC1 with L-leucine Rescues Defects Associated with Roberts Syndrome
- Other Figures
- All Figure Page
- Back to All Figure Page
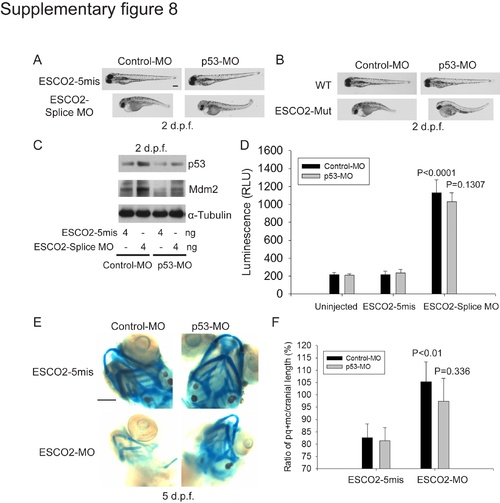
The effects of p53 knockdown on a zebrafish RBS model. (A). Embryos (1–2 cells) were co-injected with ESCO2-5mis or ESCO2-Splice MO (10 ng), and a control morpholino (Control-MO) from Gene Tools or p53 morpholino (p53-MO). After 2 d.p.f., the embryos were photographed. p53 knockdown showed some rescue of development in ESCO2 morphant embryos. Bar = 200 μm. (B). WT or ESCO2 mutant embryos were injected with Control-MO or p53-MO. After 2 d.p.f., the embryos were photographed. p53 knockdown showed some rescue of development in ESCO2 mutant embryos. (C). Embryos (1–2 cells) were co-injected with ESCO2-5mis or ESCO2-Splice MO (10 ng), and Control-MO or p53-MO. After 2 d.p.f. the embryos were harvested and analyzed by Western blot. p53-MO injection reduced p53 levels relative to the control MO in both the ESCO2-5mis and splice MO. Tubulin serves as a loading control. (D). Embryos were treated as in (C). Caspase 3/7 activity was measured as in Figure 7. p53 knockdown did not affect caspase activity in the ESCO2-splice MO. P<0.0001, ESCO2-Splice MO+Control MO vs Uninjected+Control MO or ESCO2-5mis+Control MO; P = 0.1307, ESCO2-Splice MO+p53 MO vs ESCO2-Splice MO+Control MO. (E and F). Embryos (1–2 cells) were co-injected with ESCO2-5mis or ESCO2-Splice MO (10 ng), and a control morpholino (Control-MO) from Gene Tools or p53 morpholino (p53-MO). After 5 d.p.f., the embryos were stained with alcian blue and the craniofacial length was quantified as in Figure 7. P<0.01, ESCO2-5mis+Control-MO vs ESCO2-MO+Control-MO; P = 0.336, ESCO2-MO+Control-MO vs ESCO2-MO+p53-MO. |