
FIGURE
Fig. 4
Fig. 4
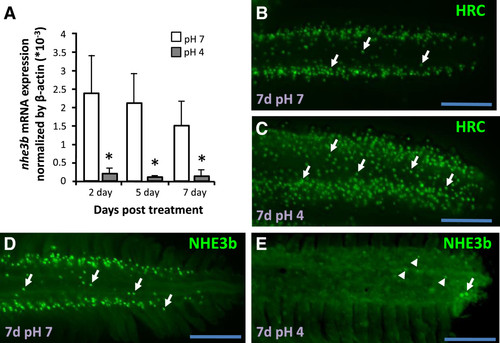
Down-regulation of nhe3b in gills under acid stress. (A): Expression of nhe3b mRNA in gills treated with control pH7 FW (white bars) or acidic pH4 FW (gray bars) for the indicated days. Mean � SD (n = 6). *p < 0.05 (Student?s t-test). (B-E): Immunostaining images of H+-ATPase (H-pump) and NHE3b in gills from adult zebrafish maintained in pH7 FW (B, D) or pH4 FW (C, E) for 7 d. Arrow, NCC or NHE3b signal; arrow head, weaker NHE3b signal. Scale bar = 100 μm. |
Expression Data
| Gene: | |
|---|---|
| Antibodies: | |
| Fish: | |
| Condition: | |
| Anatomical Terms: | |
| Stage: | Adult |
Expression Detail
Antibody Labeling
Phenotype Data
| Fish: | |
|---|---|
| Condition: | |
| Observed In: | |
| Stage: | Adult |
Phenotype Detail
Acknowledgments
This image is the copyrighted work of the attributed author or publisher, and
ZFIN has permission only to display this image to its users.
Additional permissions should be obtained from the applicable author or publisher of the image.
Full text @ Front. Zool.