
Fig. 3
- ID
- ZDB-FIG-130905-7
- Publication
- Mandal et al., 2013 - Transgenic retinoic acid sensor lines in zebrafish indicate regions of available embryonic retinoic acid
- Other Figures
- All Figure Page
- Back to All Figure Page
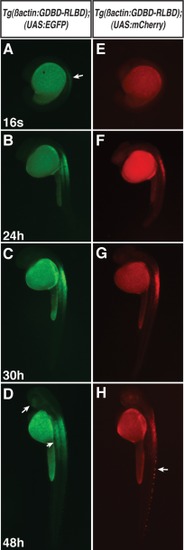
Fluorescence in the Tg(β-actin:GDBD-RLBD);(UAS:EGFP) and Tg(β-actin:GDBD-RLBD);(UAS:mCherry) lines. A, E: Fluorescence in the Tg(β-actin:GDBD-RLBD);(UAS:EGFP) line is found in the spinal cord (arrow) by the 16s stage, although expression in the Tg(β-actin:GDBD-RLBD);(UAS:mCherry) is typically not visible by this stage. B, F: Expression at 24 hpf is visible in the spinal cord, notochord, and somites. Expression in the adjacent non-spinal cord tissues is more easily visible in the Tg(β-actin:GDBD-RLBD);(UAS:EGFP) embryos. C, D, G, H: Expression in maintained in the spinal cord, notochord, and somites at 30 and 48 hpf. Expression is seen in the ventral eye by 48 hpf (arrow in D). Arrowhead in D indicates the somites. Expression in the eye of the Tg(β-actin:GDBD-RLBD);(UAS:mCherry) embryo is from the α-cry:DsRed used in the transgenic construct. Arrow in H indicates autofluorescent pigment cells. All views are lateral with anterior up. |