
Fig. 4
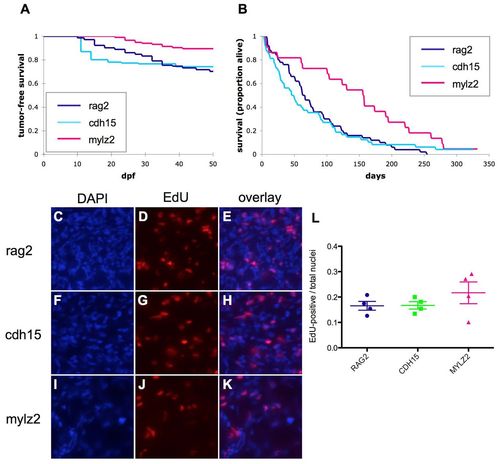
Survival of tumor-bearing fish differs in rag2, cdh15 and mylz2 tumors. (A) Fish injected with rag2:KRASG12D, cdh15:KRASG12D or mylz2:KRASG12D transgenes developed tumors with differing latency and incidence (mylz2, n=19/117; rag2, n=50/144; cdh15, n=42/146 fish developed tumors; rag2 versus mylz2, P=0.0004; cdh15 versus mylz2, P<0.0001; rag2 versus cdh15, P=0.73). (B) mylz2 tumor-bearing fish displayed better survival over time compared with rag2 and cdh15 tumor-bearing fish (rag2, n=50; cdh15, n=48; mylz2, n=22; rag2 versus mylz2, P=0.001; cdh15 versus mylz2, P=0.009; rag2 versus cdh15, P=0.72). P-values for A and B were calculated using the log-rank test. (C-L) Rates of EdU incorporation did not significantly differ among the tumor models. Fluorescent microscopic images depicting DAPI-positive (C,F,I) and EdU-positive (D,G,J) nuclei. (E,H,K) Merged images. (C-E) rag2 tumor. (F-H) cdh15 tumor. (I-K) mylz2 tumor. (L) Quantification of the ratio of EdU-positive to total nuclei. n=4 for each tumor model; P>0.05, Student?s t-test. Ratios were calculated based on the average ratio for three separate high-power images per tumor. Error bars represent s.e.m. |