Fig. 6
- ID
- ZDB-FIG-130725-31
- Publication
- Le et al., 2013 - A novel chemical screening strategy in zebrafish identifies common pathways in embryogenesis and rhabdomyosarcoma development
- Other Figures
- All Figure Page
- Back to All Figure Page
|
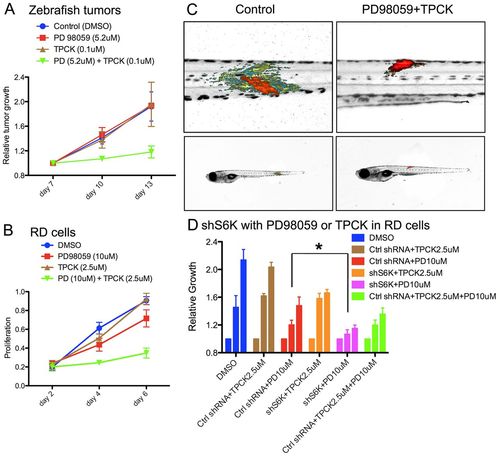
PD98059 and TPCK synergistically suppress tumor progression in zebrafish ERMS and human RD cells. (A) Relative tumor growth in zebrafish ERMS with combination treatment (5.2 μM PD98059 + 0.1 μM TPCK, n=27), PD98059 (5.2 μM, n=13), TPCK (0.1 μM, n=7) and DMSO vehicle [0.28% (v/v), n=12]. P=0.009 (ANOVA, combined treatment compared with other conditoins) at day 10. (B) Human RD cell proliferation measured by MTT assay after vehicle [0.53% (v/v) DMSO], PD98059 (10 μM), TPCK (2.5 μM) or combination treatment (10 μM PD98059 + 2.5 μM TPCK). (C) Representative overlay images of zebrafish with rag2-KRASG12D-induced tumors treated with DMSO vehicle control and a combination of PD98059 and TPCK. Color code as in Fig. 3F. (D) RD cell proliferation measured by MTT assay after cells were treated with DMSO, control (scrambled) shRNA (Ctrl shRNA), S6K1 shRNA (shS6K1), TPCK (2.5 μM) and/or PD98059 (10 μM) as indicated. Three bars of the same color represent (left to right) relative cell growth under a given treatment condition on days 5, 7 and 9. *P<0.05 (ANOVA). Error bars indicate s.e.m. |

