
FIGURE
Fig. S1
Fig. S1
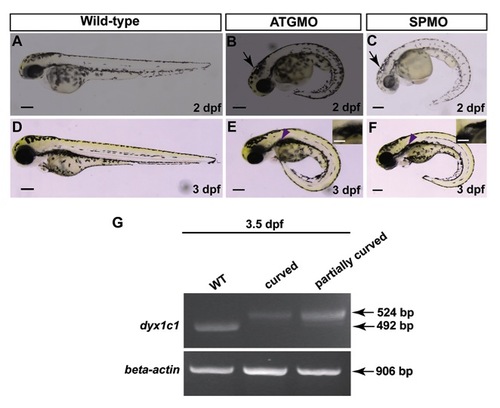
Morphological phenotypes induced by ATGMO and SPMO. Both ATGMO and SPMO when injected alone produced identical phenotypes. Hydrocephalus and kidney cysts were clearly visible in the morphants at 2 dpf (B & C) and 3 dpf (E & F) respectively as compared to the nomal phenotype in wild-type (A & D). Arrows denote hydrocephalus and kidney cysts are denoted by arrowheads. RT-PCR showing the efficiency of SPMO at 3.5 dpf in embryos showing strong and weak phenotypes (G). Scale bars indicate 100 μm. |
Expression Data
Expression Detail
Antibody Labeling
Phenotype Data
| Fish: | |
|---|---|
| Knockdown Reagents: | |
| Observed In: | |
| Stage Range: | Long-pec to Protruding-mouth |
Phenotype Detail
Acknowledgments
This image is the copyrighted work of the attributed author or publisher, and
ZFIN has permission only to display this image to its users.
Additional permissions should be obtained from the applicable author or publisher of the image.
Full text @ PLoS One