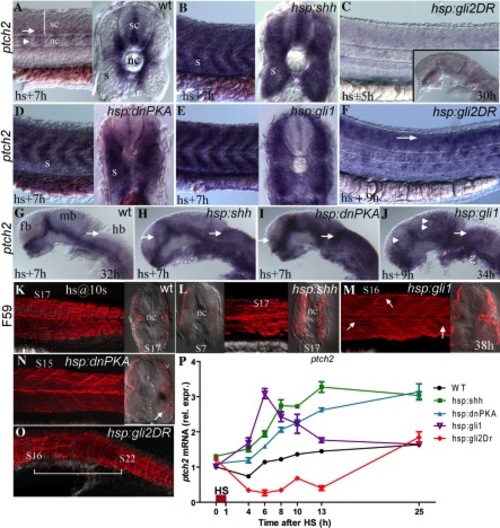
Fig. 2
- ID
- ZDB-FIG-130625-7
- Publication
- Shen et al., 2013 - Heat-shock?mediated conditional regulation of hedgehog/gli signaling in zebrafish
- Other Figures
- All Figure Page
- Back to All Figure Page
|
Timing and relative magnitude of Hedgehog (Hh) signal manipulation. A: Wild-type ptch2 expression in the trunk at 32 hours postfertilization (hpf). Cross-section shows spinal cord and somite ptch2 expression. B: Dramatically expanded ptch2 expression in the hsp:shh line 7 hr after heat shock. Cross-section shows dorsal expansion in the spinal cord and lateral expansion throughout the somites. C: ptch2 expression is dramatically reduced 5 hr following heat-shock?induced activation of the gli2DR-GFP transgene in the trunk and head (inset). D,E: ptch2 expression is expanded in both the somites and spinal cord in the hsp:dnPKA (D) and hsp:gli1 (E) transgenic lines 7 hr after heat shock. F: Nine hours following heat-shock treatment of the hsp:gli2DR line ptch2 expression reappears, with expression expanded into inappropriate dorsal domains of the spinal cord (arrow). G: Normal ptch2 expression in the head of a wild-type embryo 7 hr after heat shock. H?J: Dorsally expanded ptch2 expression in hsp:shh, hsp:dnPKA, and hsp:gli1 activator lines,7 and 9 hr after heat shock, respectively. J: Ectopic and mosaic ptch2 expression was consistently seen in the hsp:gli1 line (arrowheads). K: F59 antibody labeling reveals the normal slow muscle fiber distribution in a 38 hpf wild-type embryo that was heat shocked at the 10-somite stage (14 hpf). Cross-section of somite 17 shows the lateral position of these slow muscle fibers. L: Heat-shock activation of the hsp:shh transgene at the 10-somite stage led to ectopic slow muscle fiber differentiation starting at somite 16?17. Left panel shows normal slow muscle fibers in somite 7, which had differentiated before heat shock. Middle panel shows lateral view of trunk, with disrupted fiber visible starting around somite 17. Right panel shows a cross-section of somite 17 with increased numbers of slow muscle fibers. M,N: hsp:gli1 and hsp:dnPKA lines show subtle somite morphology defects (arrows). O: Activation of the hsp:gli2DR transgene at the 10-somite stage led to a loss of slow fibers starting at somite 16. Slow fiber differentiation appears relatively normal in somite 23, indicating Hh signaling was no longer blocked when this somite was forming. P: Time course of ptch2 mRNA expression in all four lines following a 1 hr heat shock starting at 24 hpf. Symbols report the mean value (± SEM) for each treatment at a given time point, error bars are visible only if larger than symbols. fb, forebrain; hb, hindbrain; mb, midbrain; nc, notochord; s, somite; sc, spinal cord. |

